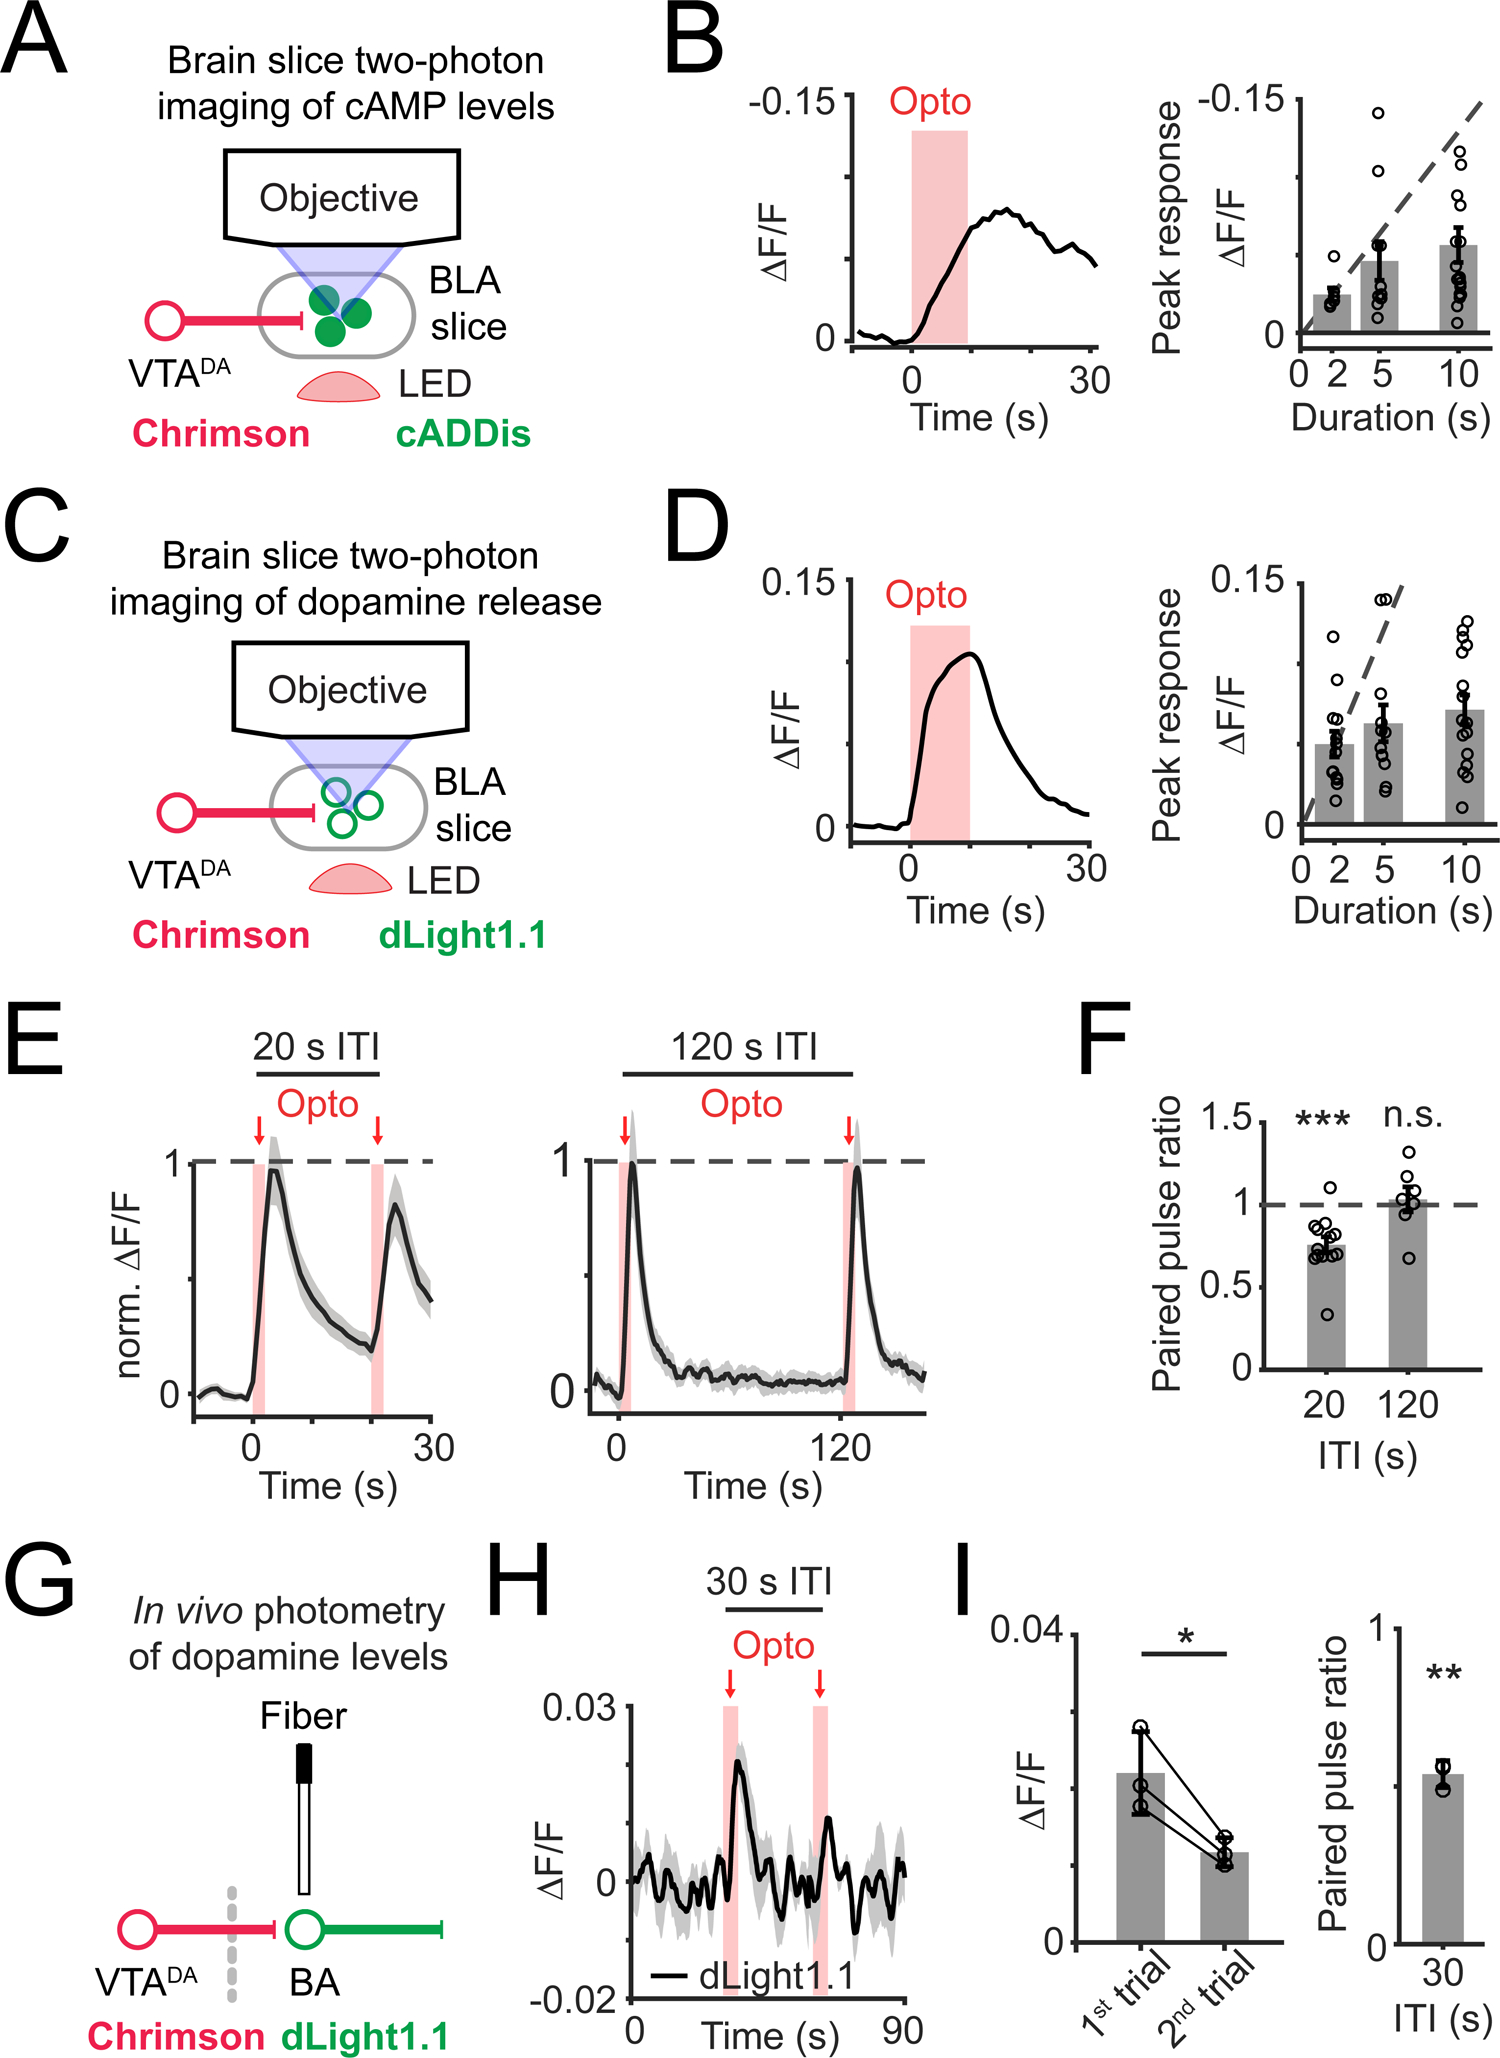
Figure 2. Synaptic depression of dopamine release restricts postsynaptic cAMP accumulation.

A) Schematic of brain slice imaging of cADDis fluorescence and photostimulation-evoked dopamine release.
B) Left: example recording of cADDis fluorescence in response to a train of red-light pulses (10 s duration; 15.5 Hz). Right: peak response of individual brain slices to photostimulation of dopamine release for 2 s (n = 7 slices, 4 mice), 5 s (n = 11 slices, 5 mice), or 10 s (n = 13 slices, 5 mice). Recordings are normalized to baseline period before the first photostimulation pulse.
C) Schematic of brain slice imaging of dopamine sensor dLight1.1 and photostimulation-evoked dopamine release.
D) Same as in (B) for dLight1.1 imaging. Stimulation duration: 2 s (n = 13 slices, 4 mice), 5 s (n = 12 slices, 4 mice), or 10 s (n = 16 slices, 4 mice).
E) Left: mean time course in response to a pair of photostimulation trains (2 s train duration at 15.5 Hz) with inter-trial intervals (ITIs) of 20 s (left; n = 13 slices, 4 mice) or 120 s (right; n = 7 slices, 2 mice). Recordings are normalized to period before the first photostimulation pulse.
F) Paired pulse ratio of peak response (second pulse train / first pulse train) for ITIs of 20 s (***, p = 0.0005, n = 13 slices, 4 mice) or 120 s (n.s., p = 0.57, n = 7 slices, 2 mice). Two-sided Wilcoxon sign-rank.
G) Schematic of in vivo photometry recordings of dLight1.1 fluorescence and photostimulation of dopamine release.
H) Mean time course of dLight1.1 fluorescence in response to photostimulation of VTADA→BA axons (5 s duration; 20 Hz; 30 s ITI). n = 3 mice.
I) Left: peak response during the first and second photostimulation pulse trains (30 s ITI). Right: paired pulse ratio of peak response (second pulse train / first pulse train). *, p = 0.03; **, p = 0.002, n = 3 mice. Two-sided paired t-test. All panels: mean ± s.e.m.
