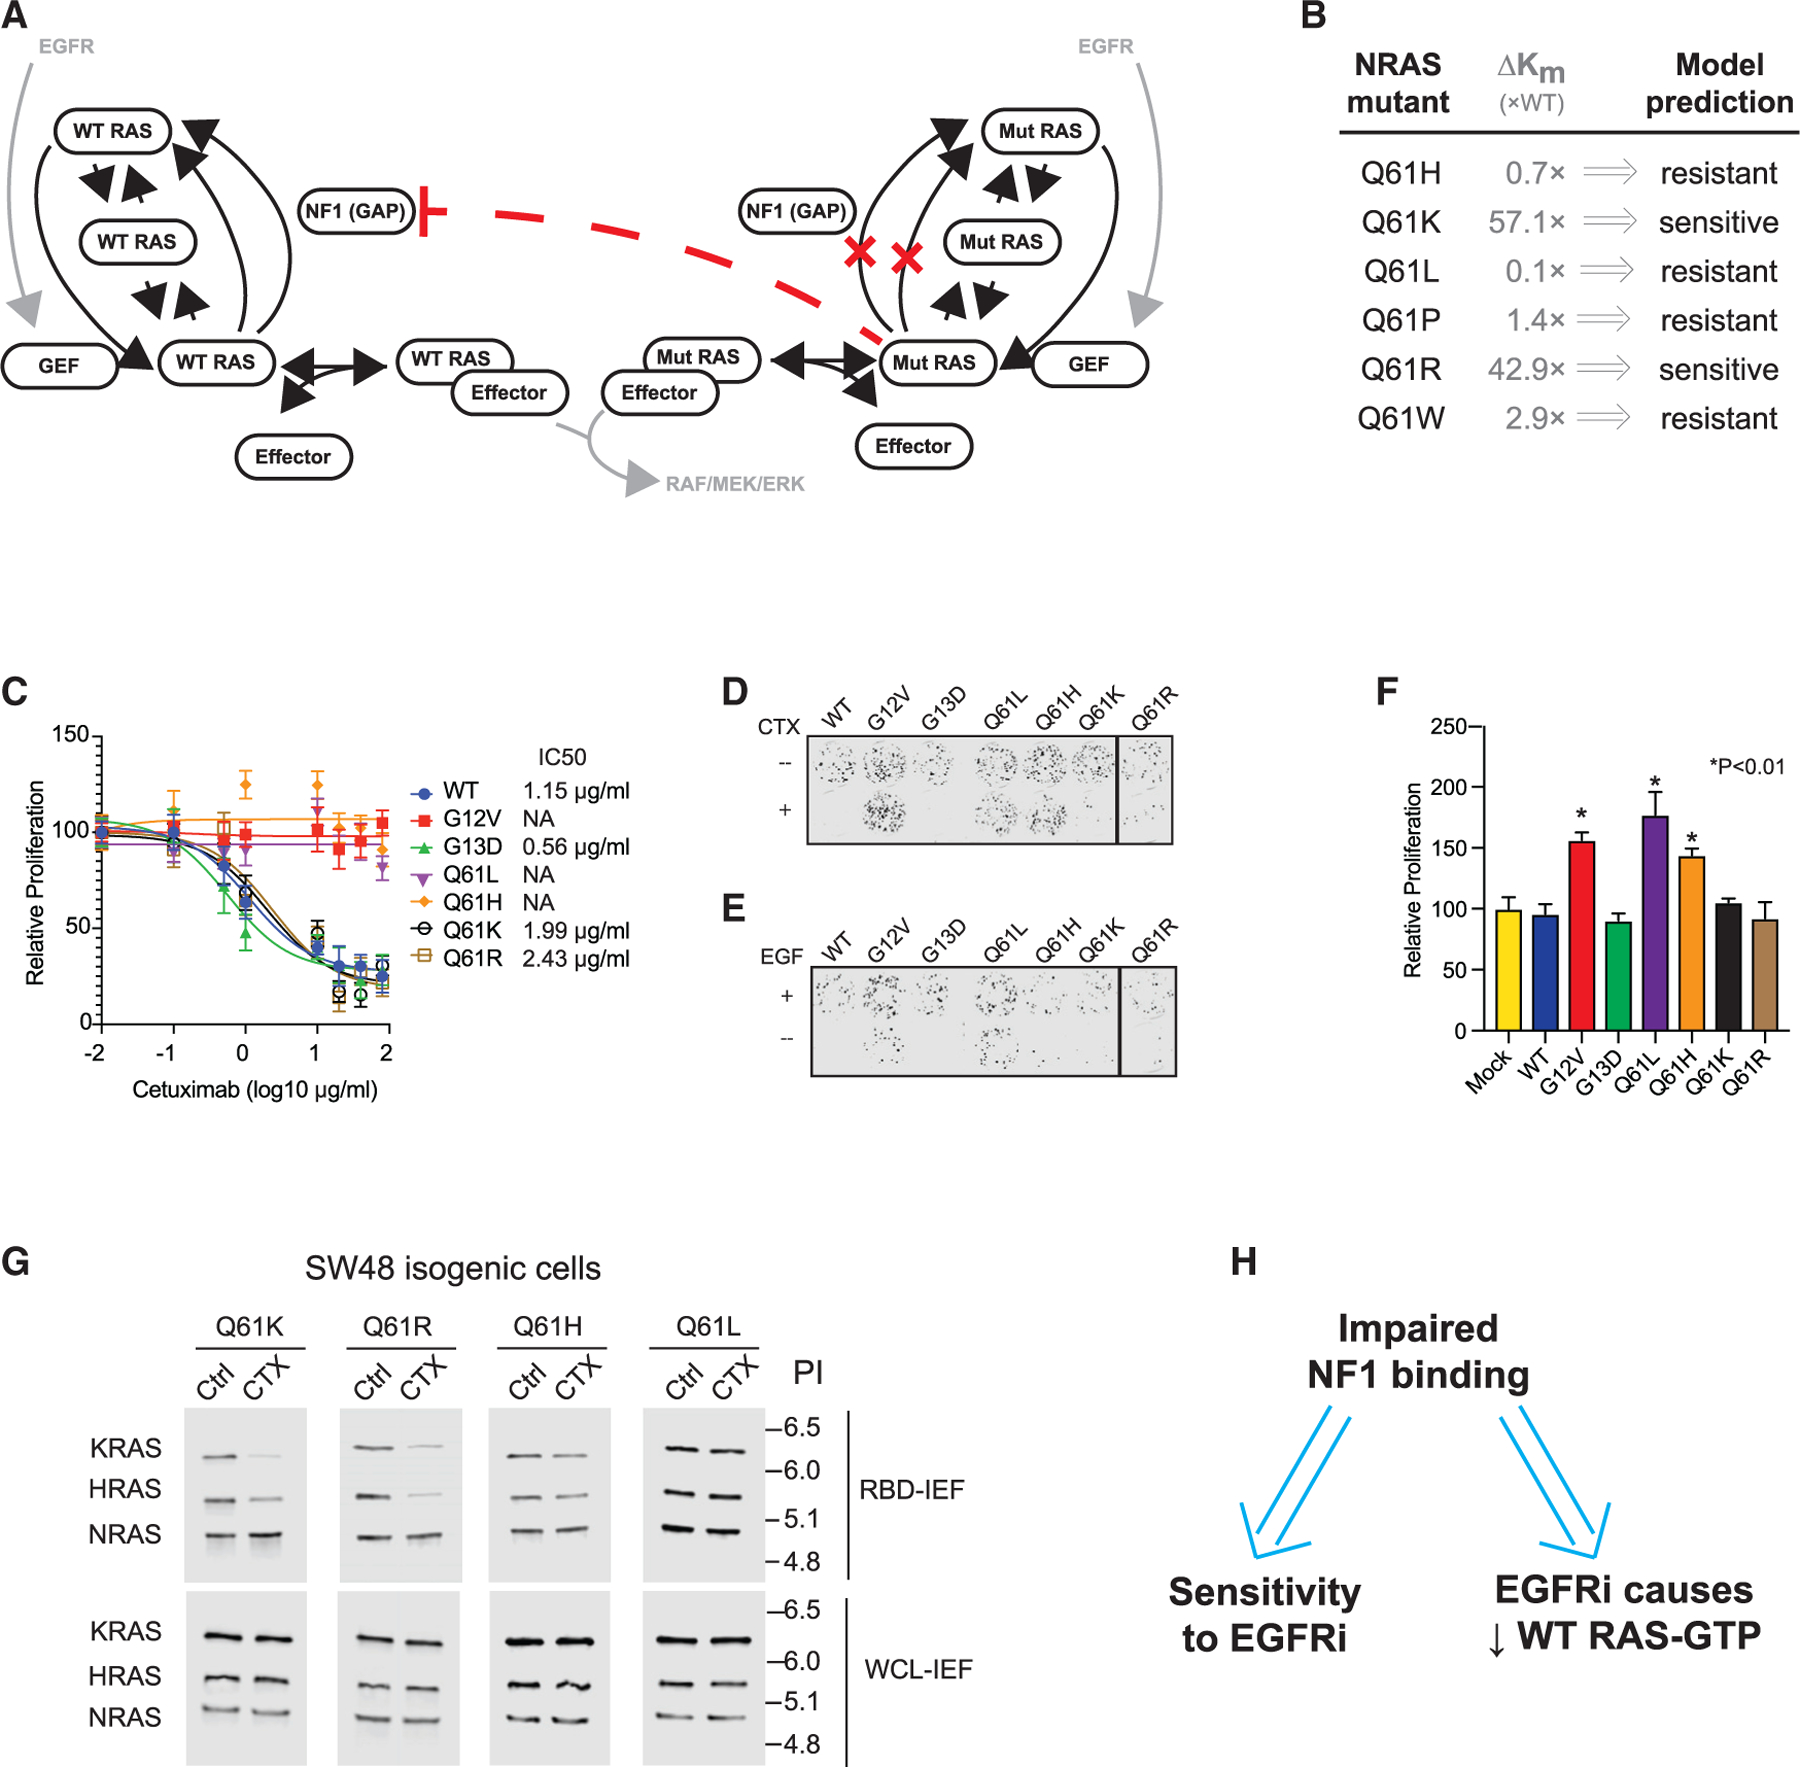
Figure 2. Computational predictions of the sensitivity of NRAS codon 61 mutations to EGFR inhibition and experimental confirmation of predicted sensitivities.

(A) Schematic of the RAS model.
(B) Reported relative change in the NF1 interaction Km for NRAS mutants, and RAS model prediction for EGFR inhibitor (EGFRi) sensitivity based on this Km value.
(C) Drug dose-response MTT assays for SW48 isogenic cells harboring the indicated RAS mutations. Data represent the mean ± SD (n = 8).
(D) Colony formation assays for SW48 isogenics treated (or not) with cetuximab.
(E) Colony formation assays for SW48 isogenic cells treated (or not) with EGF.
(F) EGFR inhibitor resistance assays. Data are means ± SD (n = 8). Significance was determined with *p < 0.01. Statistical significance was computed with one-way ANOVA followed by the post hoc Tukey test for multiple comparisons.
(G) RBD-IEF RAS activation assays for NRAS SW48 isogenics treated with cetuximab.
(H) Computational and experimental analyses both suggest that impaired binding to NF1 by a RAS mutant implies sensitivity of colon cancer cells with that mutant to EGFR inhibition, and also suggest that sensitivity follows from reductions of WT RAS-GTP upon EGFR inhibitor treatment.
(C) through (G) are each representative of three independent experiments.
