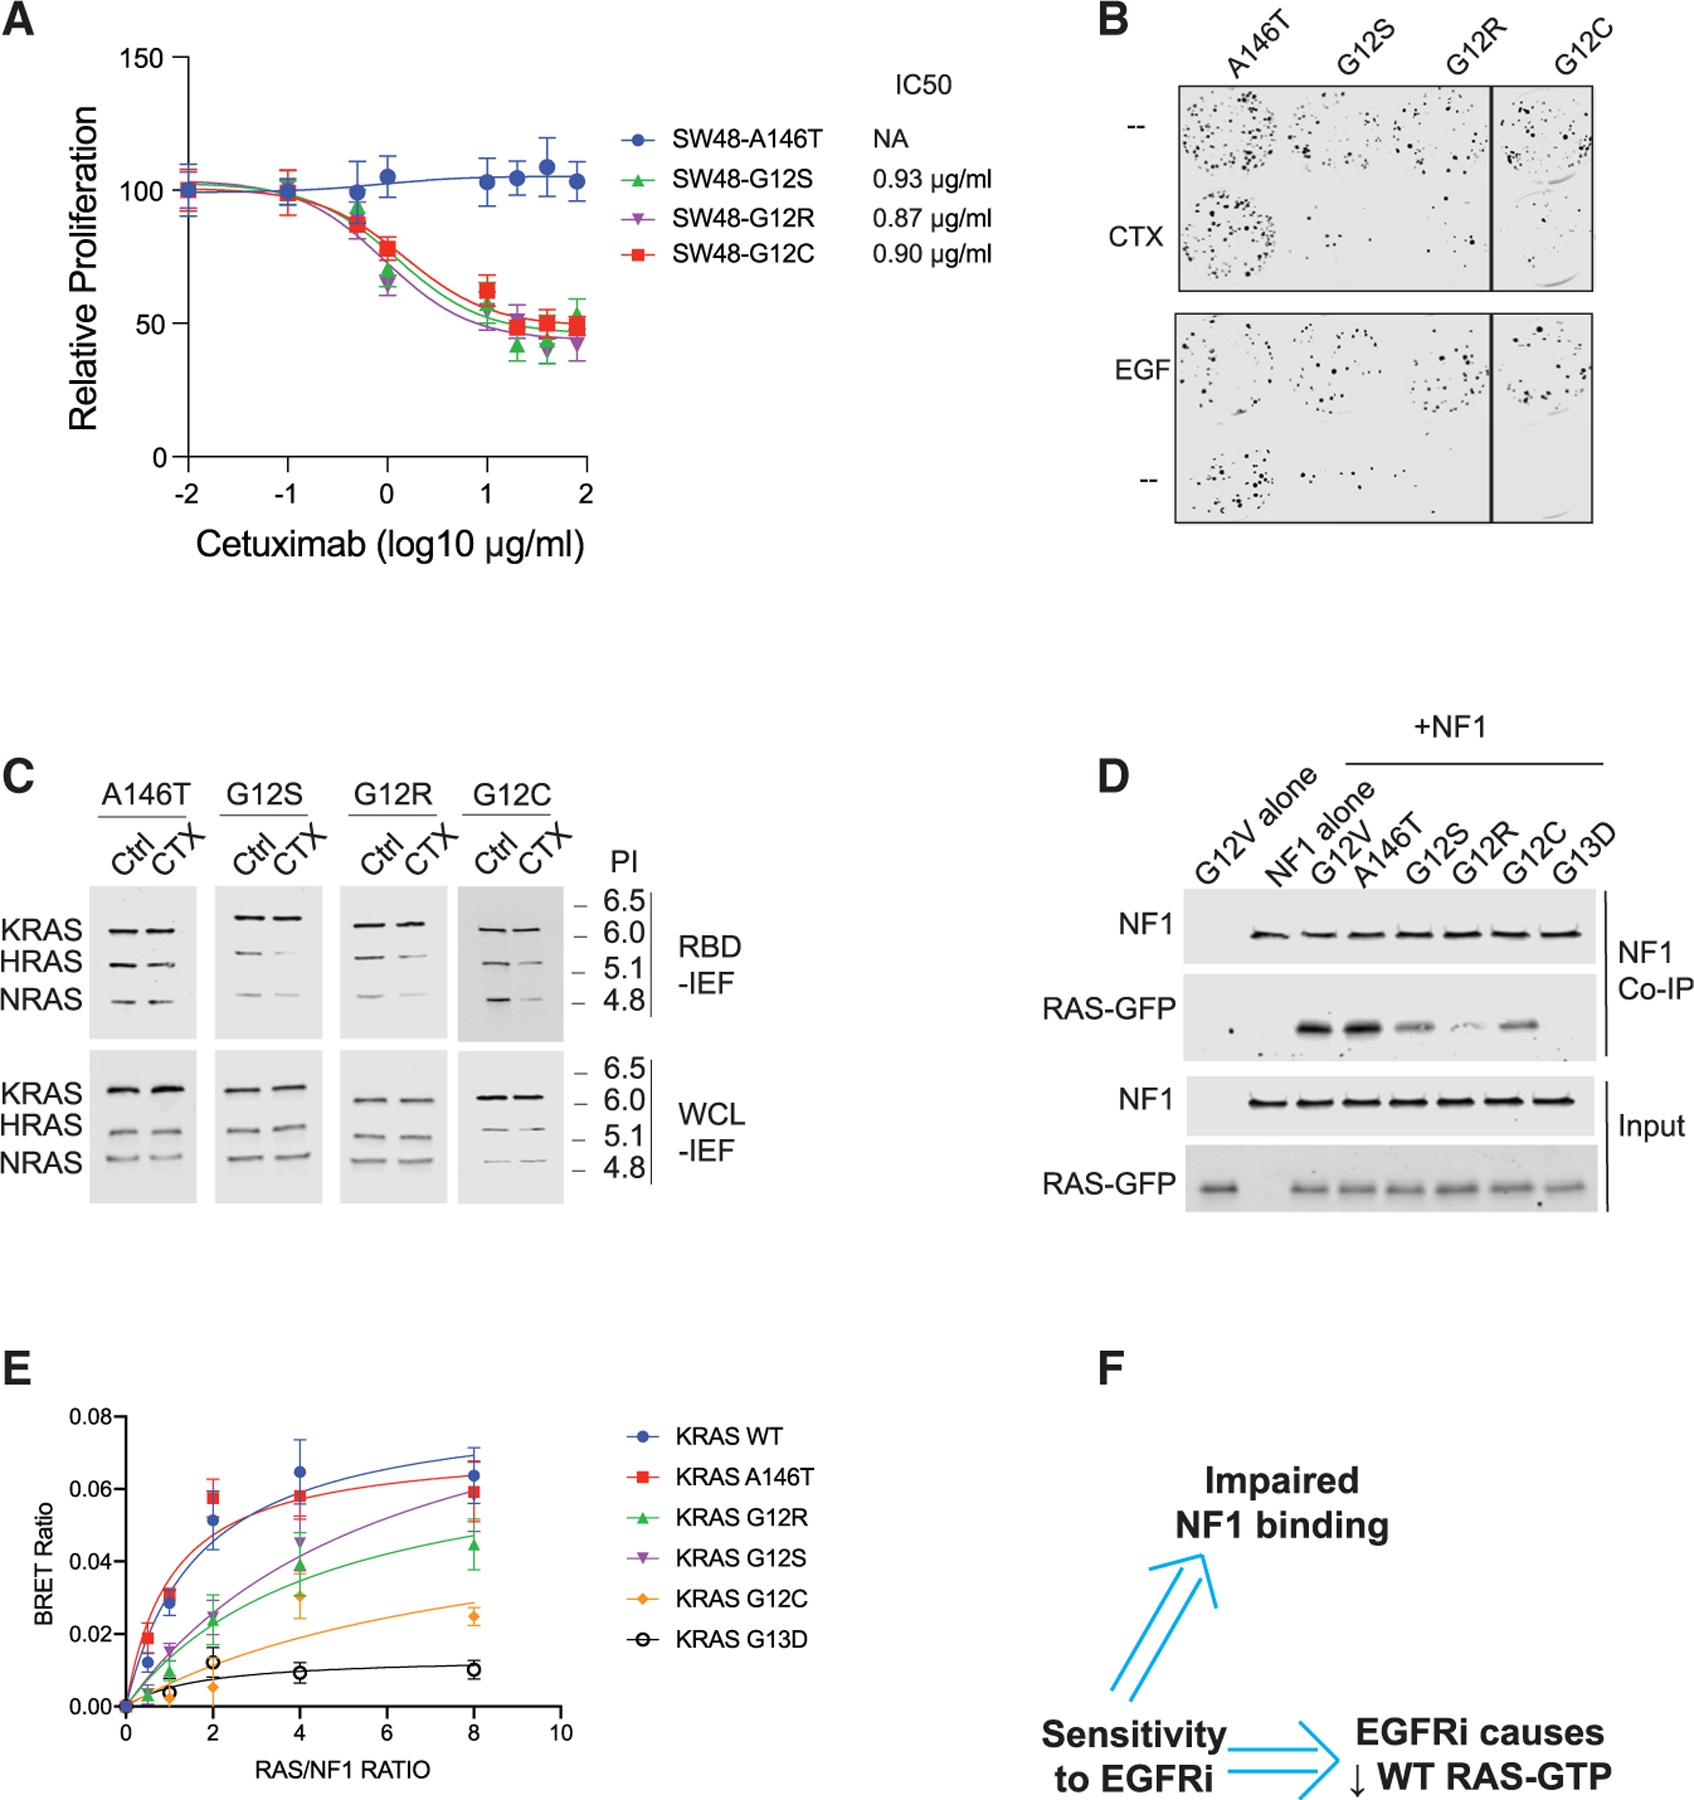
Figure 3. Isogenic cell line-based empiric screening finds three KRAS mutants that indicate sensitivity to EGFR inhibition, each of which supports the reduced NF1-binding and WT RAS-GTP level mechanism.

(A) Drug dose-response assays for KRAS A146T, G12C, G12R, and G12S SW48 isogenic cells. Data represent the mean ± SD (n = 8).
(B) Colony formation assays for SW48 isogenics treated (or not) with cetuximab (top) and treated (or not) with EGF (bottom).
(C) RBD-IEF RAS activation assays for SW48 isogenics treated with cetuximab.
(D) NF1 co-immunoprecipitation (coIP) assay for NF1 with KRAS G12V, A146T, G12S, G12R, G12C, and KRAS G13D.
(E) BRET measurements of interactions between NF1 and RAS. Data represent the BRET ratio ± SD from eight biological replicates (n = 8).
(F) Empirical screens to find EGFR inhibitor (EG-FRi)-sensitive RAS mutant genotypes suggest EGFR inhibitor sensitivity implies impaired binding of that RAS mutant to NF1, and implies that the sensitive cell displays reductions in WT RAS-GTP upon EGFR inhibition.
(B) through (E) are each representative of three independent experiments. CTX, cetuximab; NA, not applicable; Ctrl, control; WCL, whole cell lysate; PI, isoelectric point.
