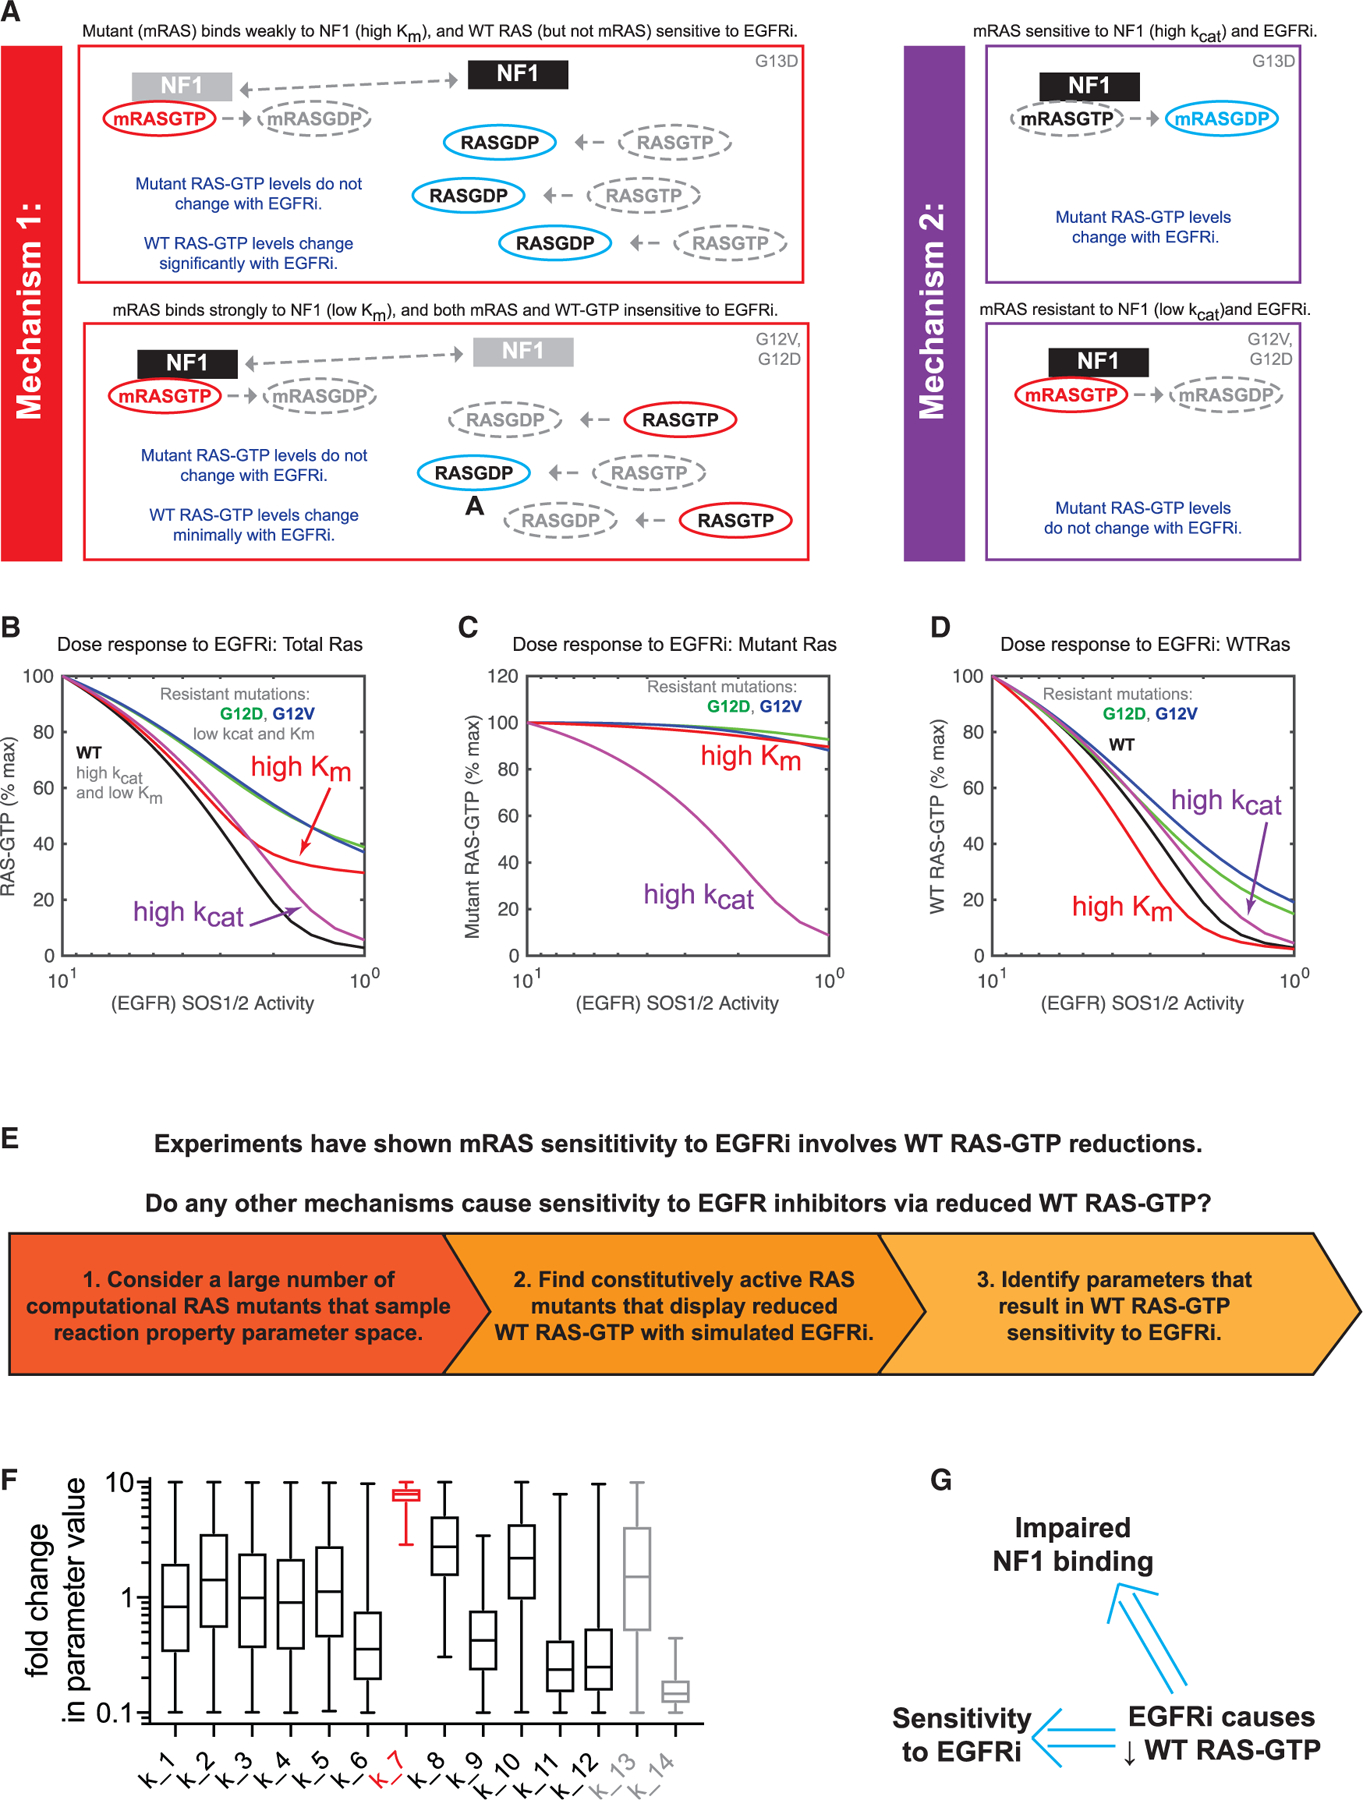
Figure 4. Computational modeling suggests a reduction in WT RAS-GTP upon EGFR inhibition implies impaired NF1 binding and EGFR inhibitor sensitivity.

(A) Schematics presenting two different proposed mechanisms to explain how KRAS G13D CRCs respond to EGFR inhibitors (EGFRi).
(B) Computational simulations of EGFR inhibition for both mechanism 1 (red) and mechanism 2 (purple). Simulated dose responses of RAS G12V (green), G12D (blue), and WT (black) are provided for comparison. The proportion of total RAS (WT and mutant) that is bound to GTP is the model output.
(C) Computational simulations, as in (B), but with the model output limited to the proportion of mutant RAS that is bound to GTP.
(D) Computational simulations, as in (B), but with the model output limited to the proportion of WT RAS that is bound to GTP.
(E) Schematic displaying the computational approach to search for alternative mechanisms of RAS mutant network sensitivity to EGFR inhibition that involve WT RAS-GTP reduction at levels approximately the same as found when G13D parameters are utilized.
(F) Values from all of the parameter sets that resulted in EGFR sensitivity through WT RAS-GTP reduction without mutant RAS-GTP reduction. Parameters are presented normalized to the value of the same parameter in WT RAS-GTP. Whiskers span from minimum to maximum values. The Km of the interaction between NF1 and a modeled RAS mutant (k_7) is indicated in red. Parameter definitions are provided in Figure S4A.
(G) Computational screens suggest that a reduction in WT RAS-GTP upon EGFR inhibition implies both an overall sensitivity to EGFR inhibition and that any such RAS mutant has a reduced Km for NF1
