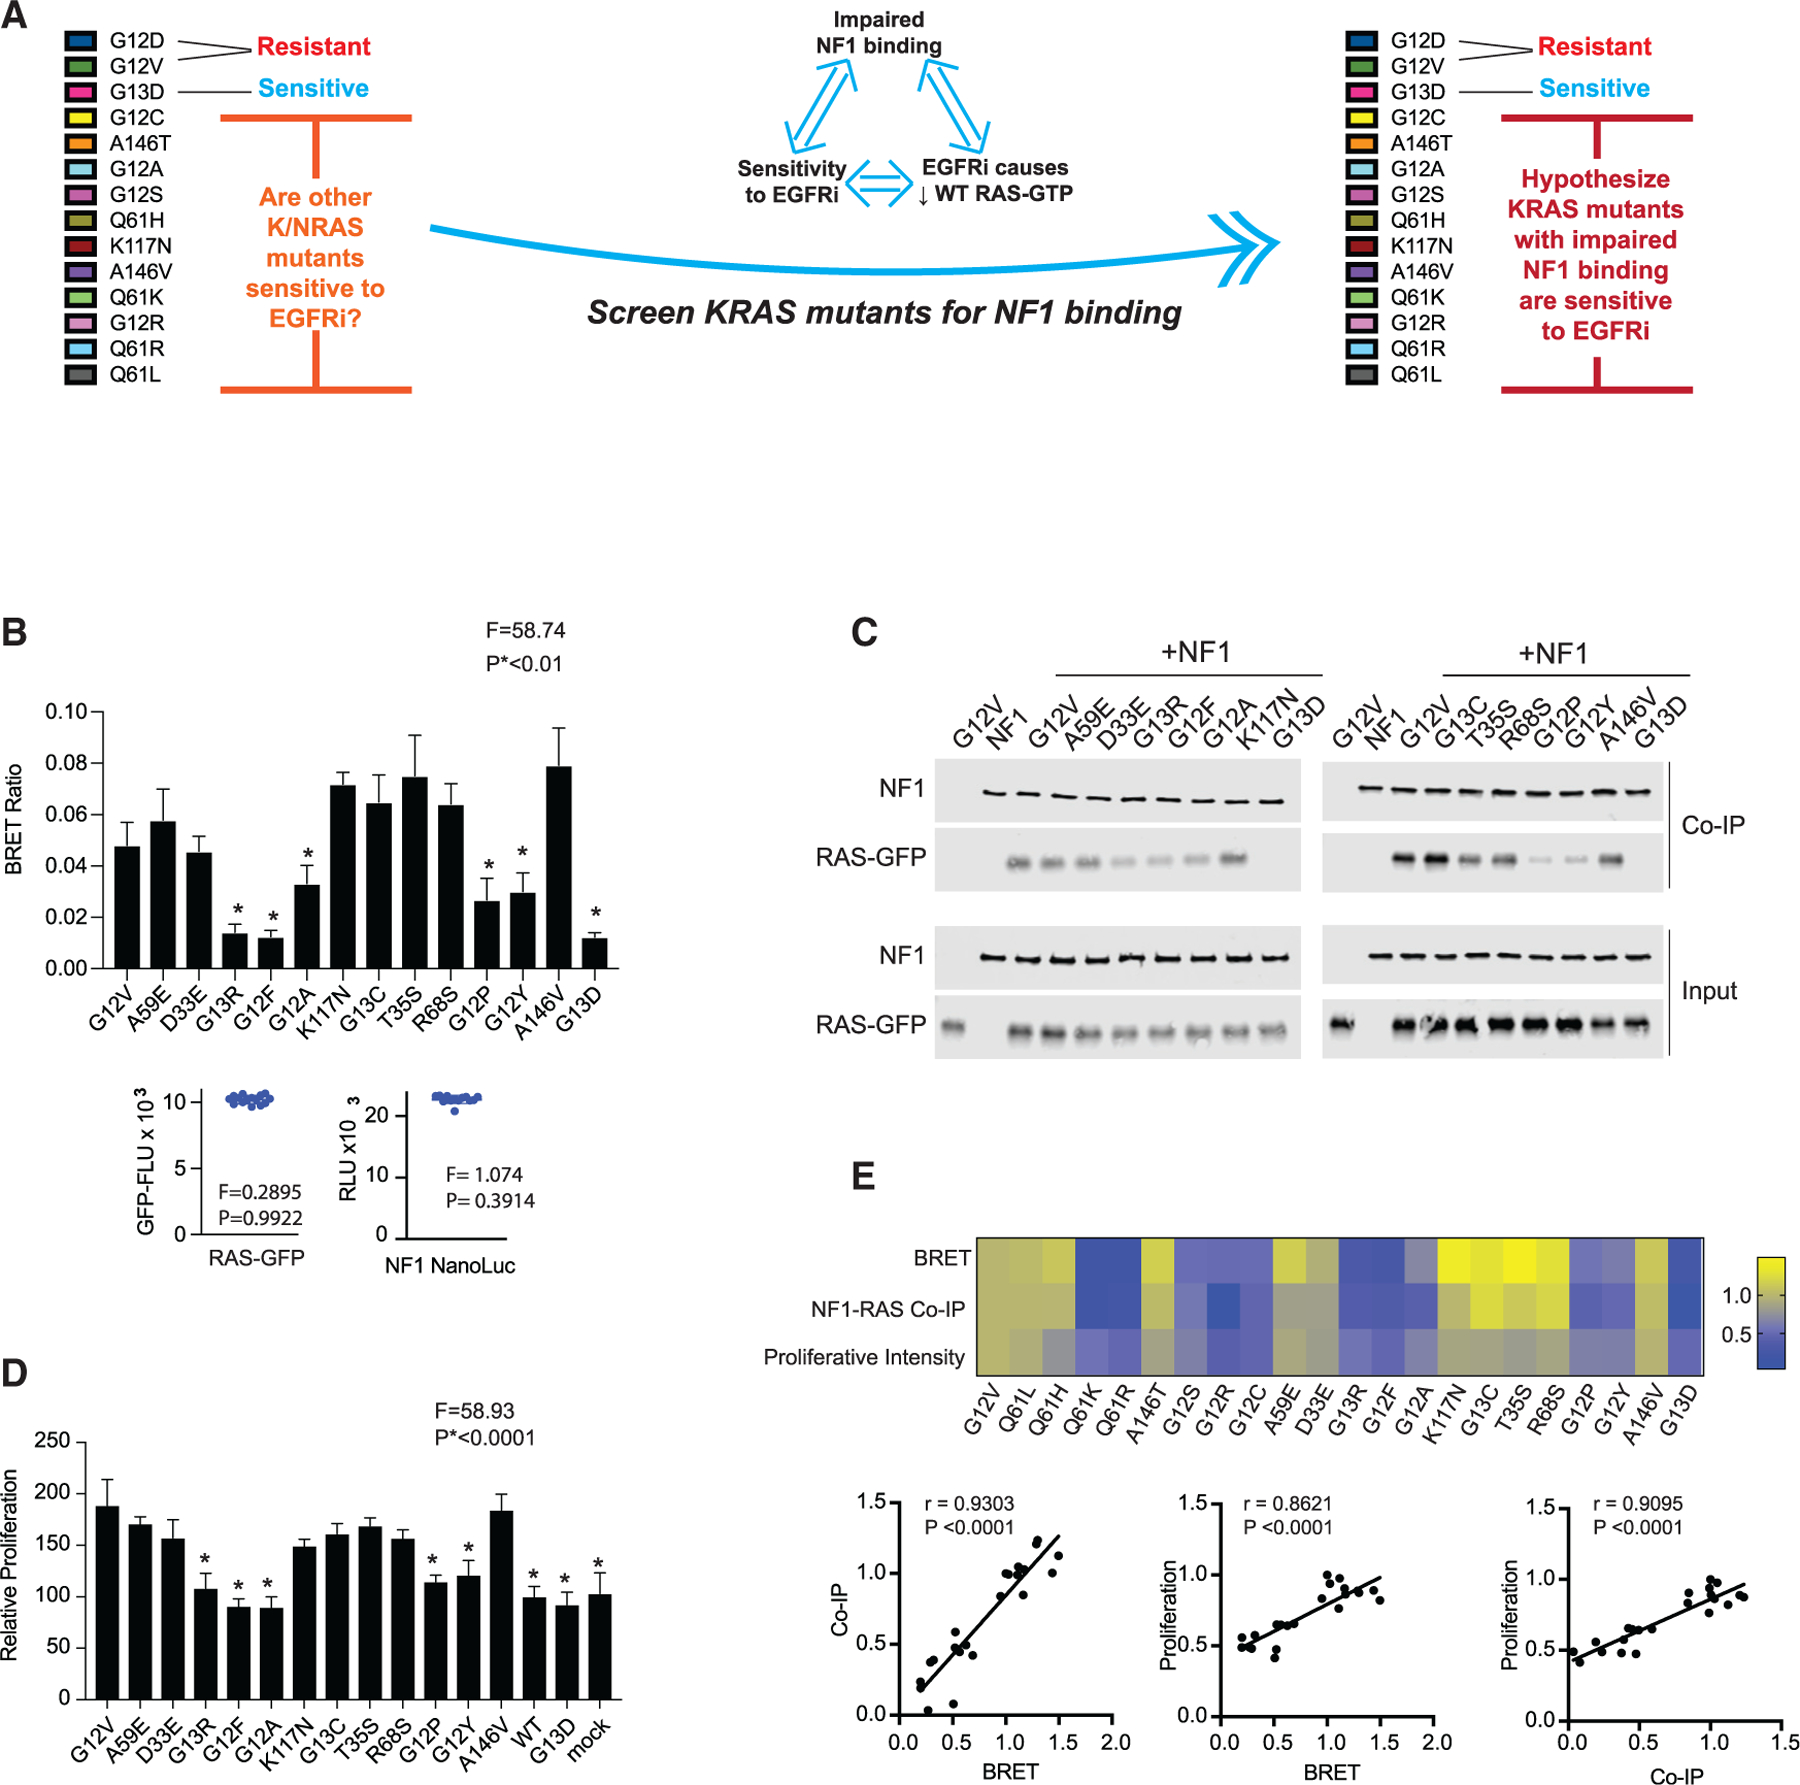
Figure 5. NF1 interaction strength screening identifies an additional five KRAS mutants that are sensitive to EGFR inhibition.

(A) Schematic to summarize that our analysis up to this point suggests that sensitivity to EGFR inhibition, impaired binding of a RAS mutant to NF1, and the reduction of WT RAS-GTP upon treatment of a mutant RAS CRC cell with an EGFR inhibitor (EGFRi) are associated. We thereby propose that the measurement of the relative strength of binding between mutant RAS and NF1 can serve as a method to infer sensitivity to EGFR inhibition.
(B) BRET measurements of interactions between NF1 and RAS to evaluate 12 additional KRAS mutants. Data represent the BRET ratio ± SD. Statistical difference was determined by one-way ANOVA followed by the post hoc Tukey test for multiple comparisons. Equal amounts of BRET donor and acceptor (NF1-NanoLuc/ mutant RAS-GFP) were expressed as seen in distribution plots (bottom), where data points are representative of mean relative luciferase units (NF1-NanoLuc) and mean GFP fluorescence units (RAS mutant) from the same samples in the histogram. There was no statistical difference among NF1-NanoLuc or RAS-GFP signals. *p < 0.01.
(C) NF1 co-immunoprecipitation (coIP) assays for the 12 additional KRAS mutants.
(D) EGFR inhibitor resistance assays for the 12 additional KRAS mutants. Histograms and error bars represent the mean ± SD (n = 8). Statistical difference was determined by one-way ANOVA followed by the post hoc Tukey test for multiple comparisons.*p < 0.0001.
(E) Comparisons of BRET assays, NF1 coIP assays, and proliferation assays. Data are normalized to KRAS G12V within each group of assays. Pearson correlation coefficients and p values are provided for each set of comparisons.
(B) through (D) are each representative of three independent experiments.
