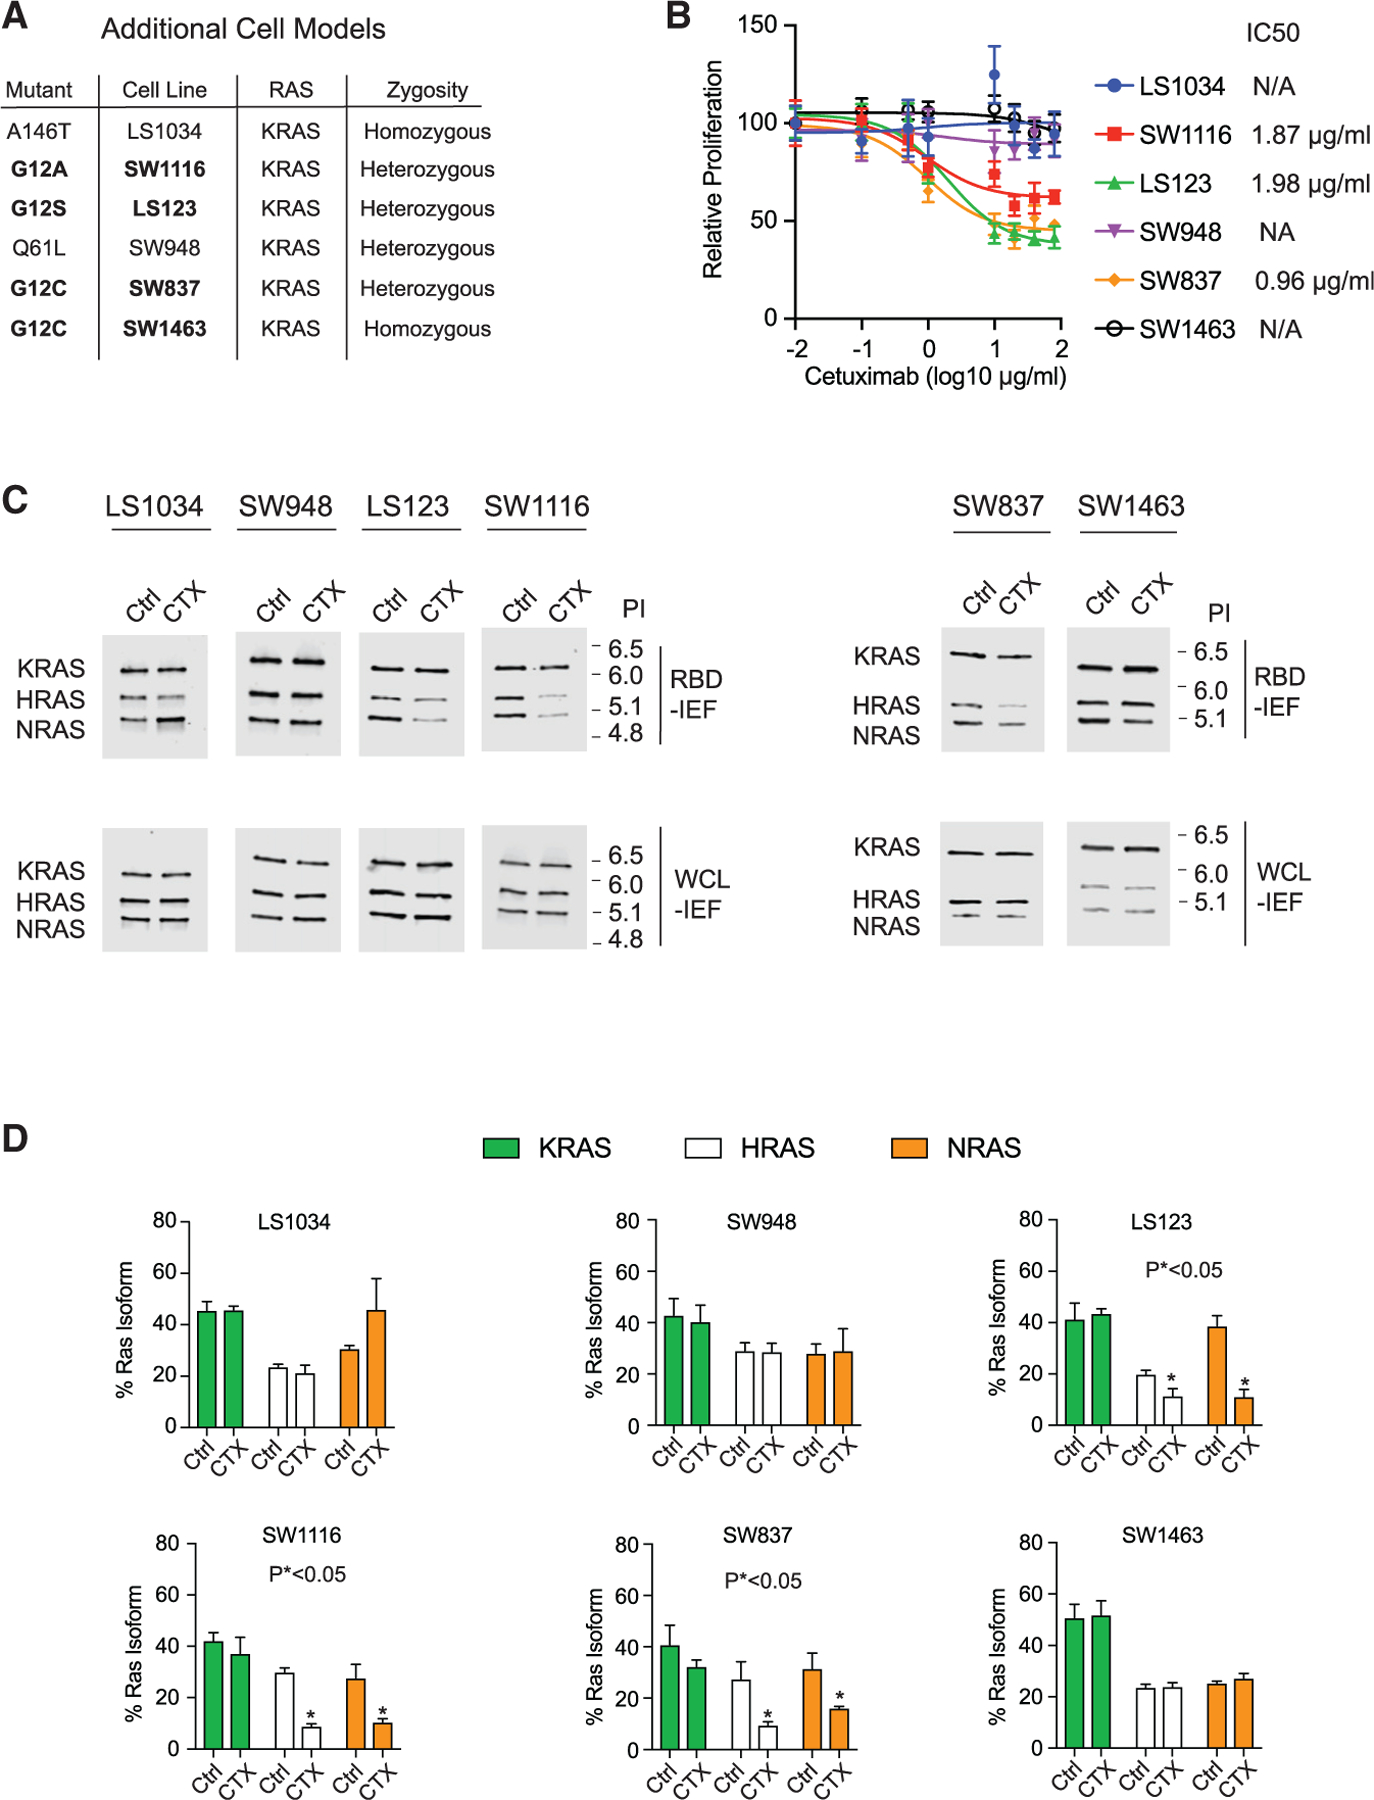
Figure 6. Validation of identified EGFR inhibitor-sensitive RAS mutants in additional model systems.

(A) Table of additional RAS mutant CRC cell lines that were investigated for EGFR inhibitor sensitivity.
(B) Drug dose-response assays for the additional cell lines. Data points and error bars represent the mean ± SD (n = 8).
(C) RBD-IEF after cetuximab treatment for theadditional cell lines.
(D) Quantification of RAS-GTP levels from RBD-IEF. Data points and error bars represent the mean ± SD from three separate experiments. Statistical significance was determined by unpaired two-tailed t est between untreated and treated conditions. *p < 0.05.
(B) and (C) are each representative of three independent experiments. CTX, cetuximab; NA, not applicable; Ctrl, control; WCL, whole cell lysate, PI, isoelectric point.
