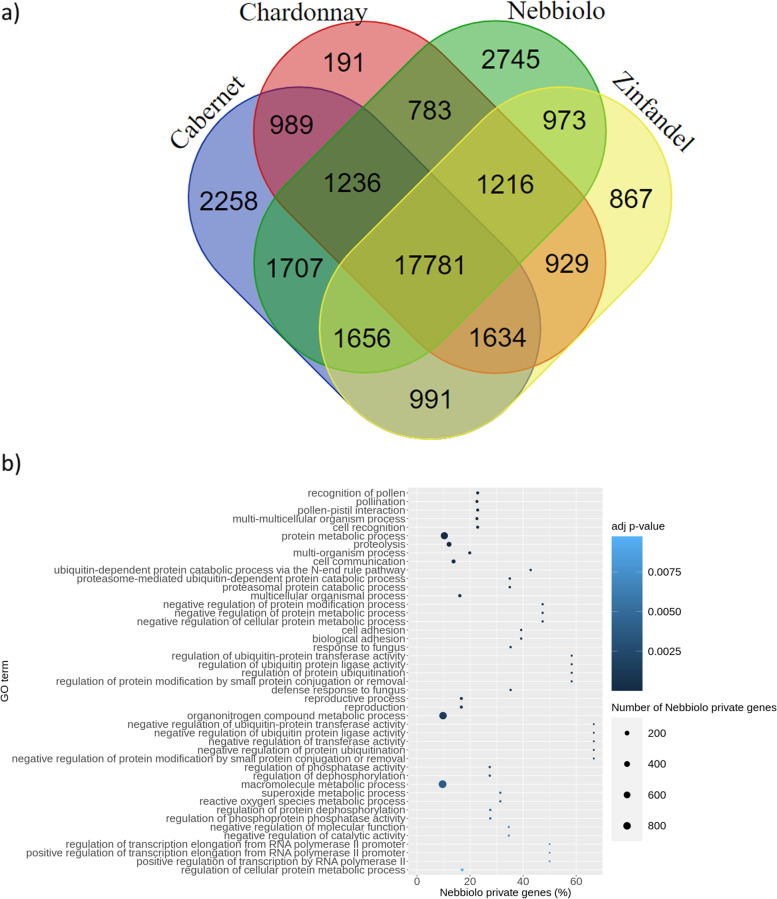
Fig. 1.
A comparison among ‘Nebbiolo’, ‘Cabernet Sauvignon’, ‘Chardonnay’ and ‘Zinfandel’ gene families. a) Venn diagram showing the number of shared and cultivar-specific gene families. b) Functional enrichment analysis of the biological processes associated to ‘Nebbiolo’ private genes. For each significantly enriched GO term, the number of ‘Nebbiolo’ associated private genes is represented, along with the percentage of genes associated with a GO that are private to ‘Nebbiolo’. The size and color of the circles represent the number of ‘Nebbiolo’ private genes and the adjusted p-value, respectively. Only GO terms with adjusted p-value < 0.01 are shown

