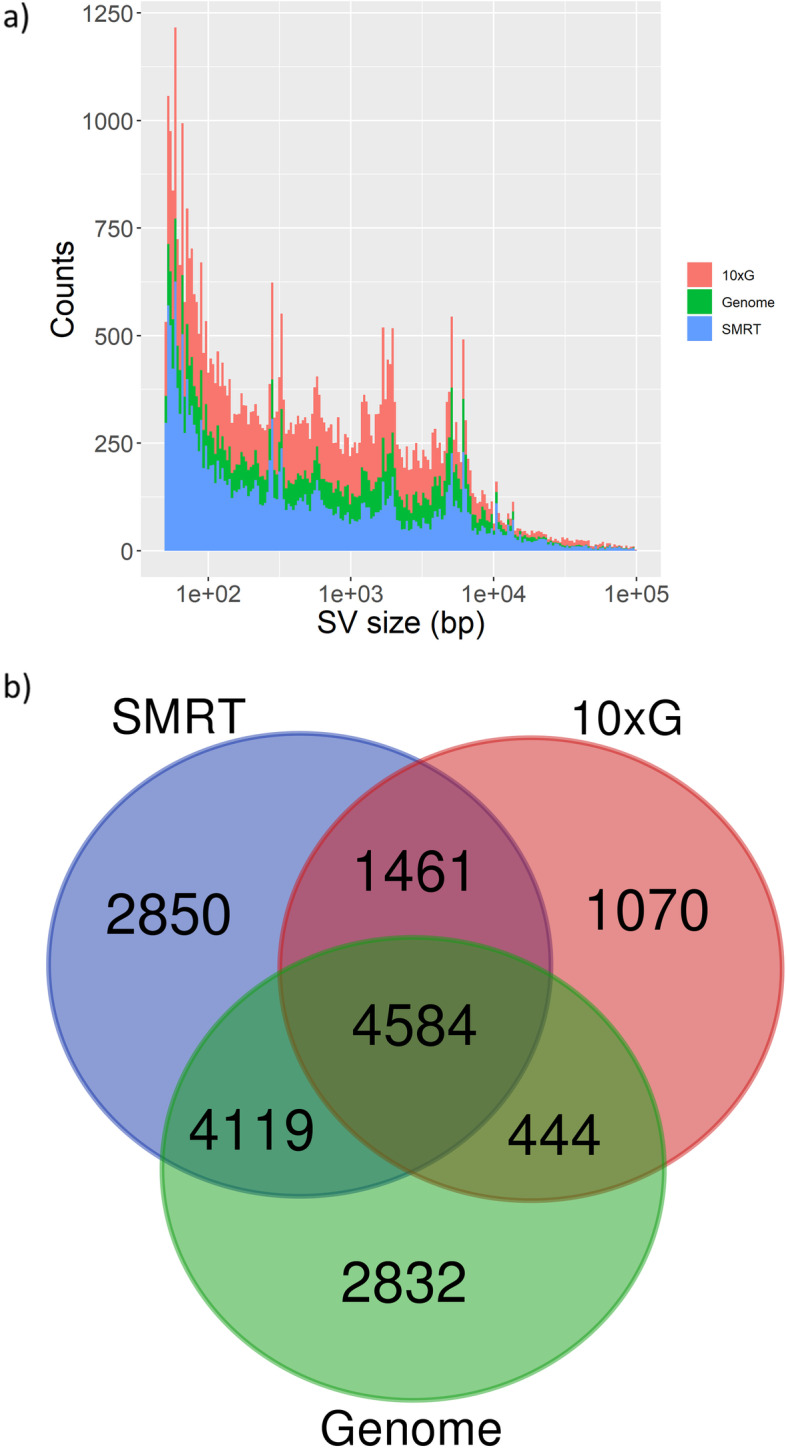
Fig. 2.

Structural Variants (SVs) between ‘Nebbiolo’ CVT 71 haplotypes identified by three different methodological approaches. a) Bar plot showing SVs size distribution. For each size, a coloured bar represents the number of SVs identified by each of the three approaches. The sizes of SVs are represented in log-scale. b) Venn diagram showing SVs intersection identified by each approach. Intersection is based on the genomic coordinates at which SVs were called. Abbreviations and colour code for both images: 10xG = 10 × Genomics linked-reads (red); SMRT = PacBio SMRT long-reads (blue); Genome = Genome to genome alignment (green)
