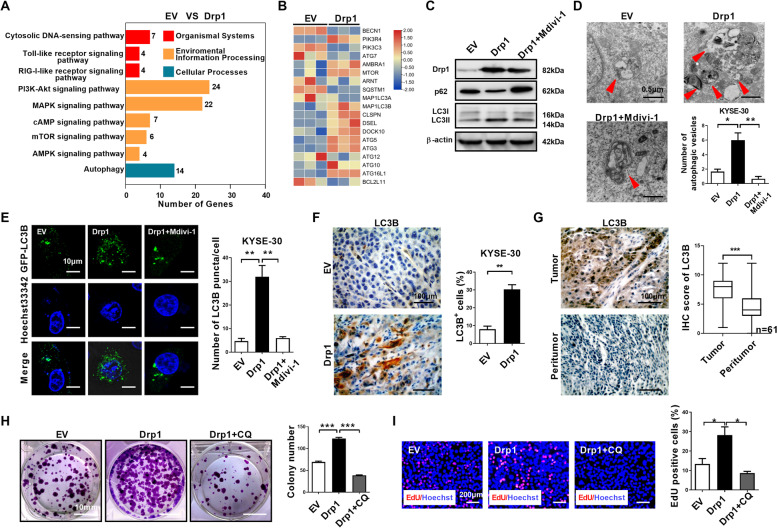
Fig. 3.
Drp1 overexpression regulates autophagy in ESCC cells. (A) RNA sequencing was performed on ESCC cells as indicated to screen differentially expressed mRNAs. Signaling pathway were plotted according to enriched gene ratio. (B) Heat map analysis of RNA sequencing for autophagy associated gene expression in ESCC cells as indicated. (C) Western blot analyses were performed in ESCC cells as indicated with antibodies specific for the proteins shown. (D) Representative transmission electron microscopy images of double-membrane autophagosomes in ESCC cells as indicated. Scale bar: 0.5 μm. (E) Representative images of fluorescent LC3B puncta (green) in ESCC cells as indicated. Scale bar: 10 μm. (F) Representative immunohistochemical (IHC) staining images of LC3B in xenograft tumors developed from KYSE-30 cells as indicated. Scale bar: 100 μm. (F) Colony-forming potential were detected in KYSE-30 cells as indicated. Scale bar: 10 mm. (G) Representative immunohistochemical (IHC) staining images of LC3B in paired ESCC tissues (n = 61). Scale bar: 100 μm. (H and I) Cell proliferation was evaluated by colony formation EdU incorporation assay in KYSE-30 cells as indicated. Scale bar: 200 μm. The data shown are the mean ± SEM from three separate experiments. Drp1, expression vector encoding Drp1; EV, empty vector. P value from t tests. *, P < 0.05; **, P < 0.01; ***, P < 0.001

