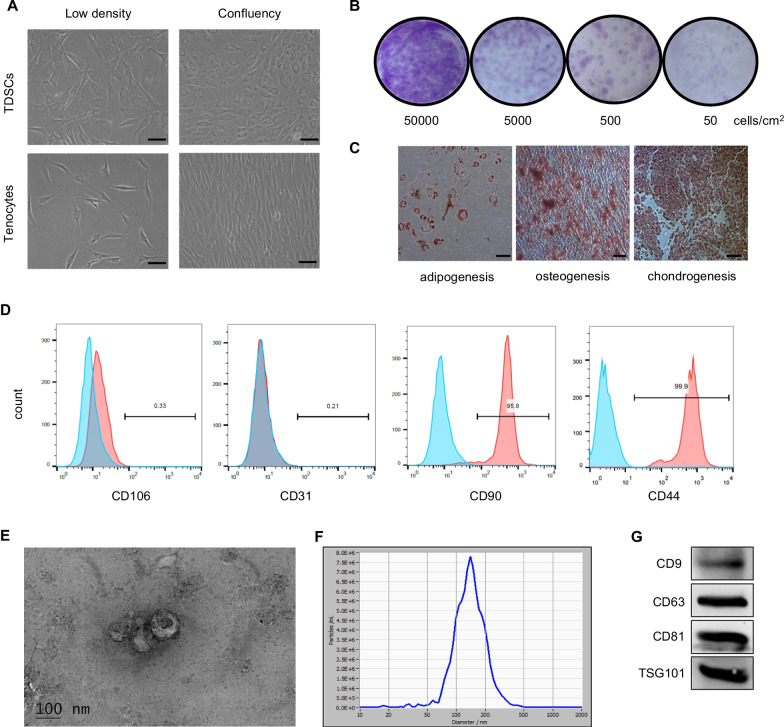
Fig. 1.
Characterization of TDSCs and TDSC-Exos. A Morphology of TDSCs and tenocytes. Scale bar: 50 μm. B Colony forming assay showed that TDSCs could form colony at a low cell density. C TDSCs exhibited multi-potential differentiation capacity for adipogenesis, osteogenesis and chondrogenesis. Scale bar: 50 μm. D Flow cytometric analysis of cell surface markers of TDSCs. Blue curves represent isotype controls, and red curves represent measured surface markers of TDSCs. E Morphology of TDSC-Exos observed by TEM. Scale bar: 100 nm. F The size distribution of TDSC-Exos peaks at 138.8 nm. G Exosomal markers (CD9, CD63, CD81 and TSG101) in TDSC-Exos were measured by western blotting

