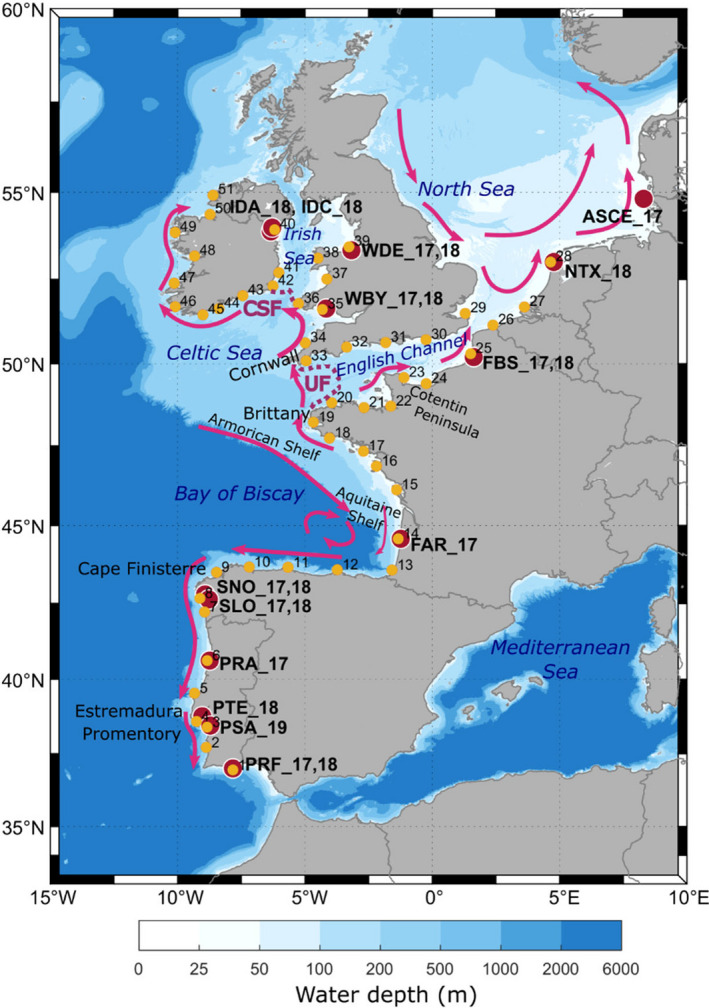
FIGURE 1.

Study area for Cerastoderma edule genetic analysis and larval dispersal modelling. Ocean bathymetry is shaded in blue. Summer surface currents are schematically represented by magenta‐coloured arrows (see section Study Area for a detailed description and references). Locations of fronts are depicted by purple dotted lines (CSF, Celtic Sea Front; UF, Ushant Front). Location of the C. edule beds for the genetic analysis are shown in dark red (see Table 1 for location codes) and particle release locations for larval dispersal modelling are shown in yellow and numbered from 1 to 51. Location codes in panel A are detailed in Table 1
