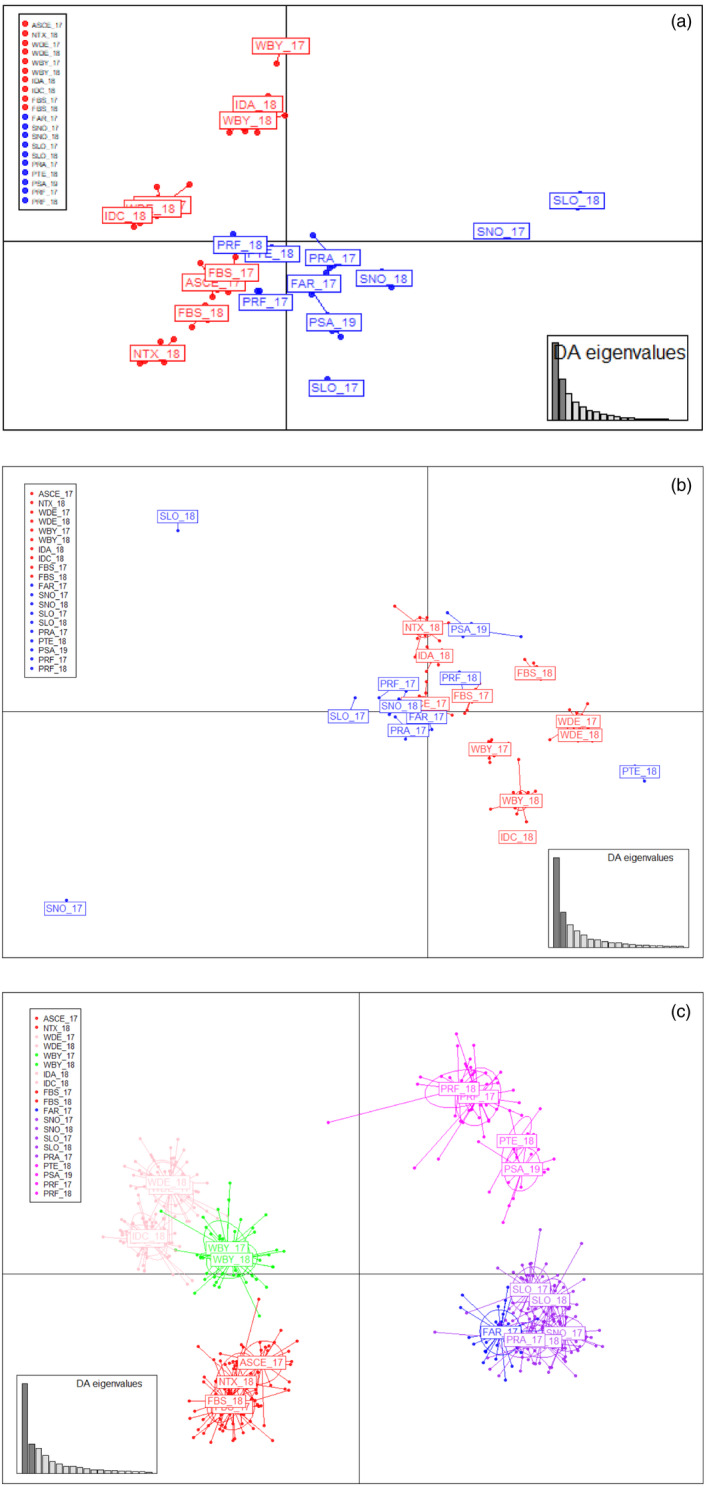
FIGURE 4.

Discriminant analysis of principal components plots of Cerastoderma edule. The weight of retained discriminant analysis (DA) eigenvalues representing >90% of variance are shown on right bottom box. Results using the complete data set (a), neutral data set (b) and divergent outlier data set (c) are shown. Codes are given in Table 1
