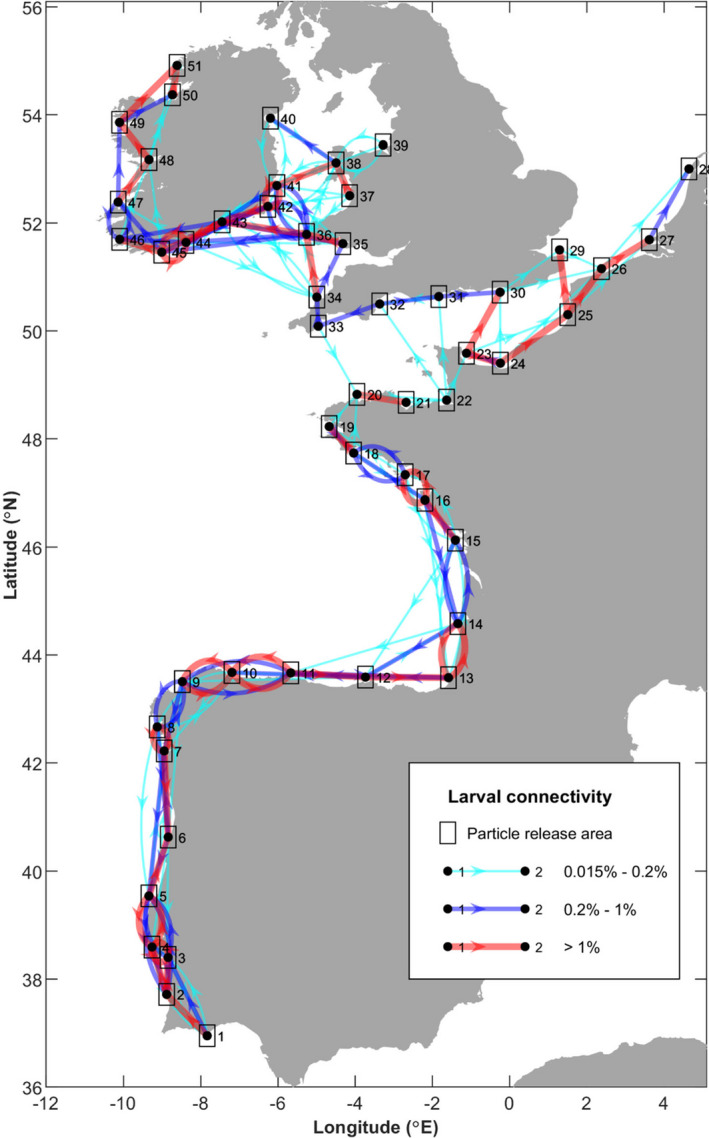
FIGURE 7.

Mean larval connectivity pathways for April to September from 2016 to 2018 releases at depths of 1, 15 and 30 m. The direction of the arrows indicates the direction of larval transport, and the colour and thickness of the connection display the strength of the connection
