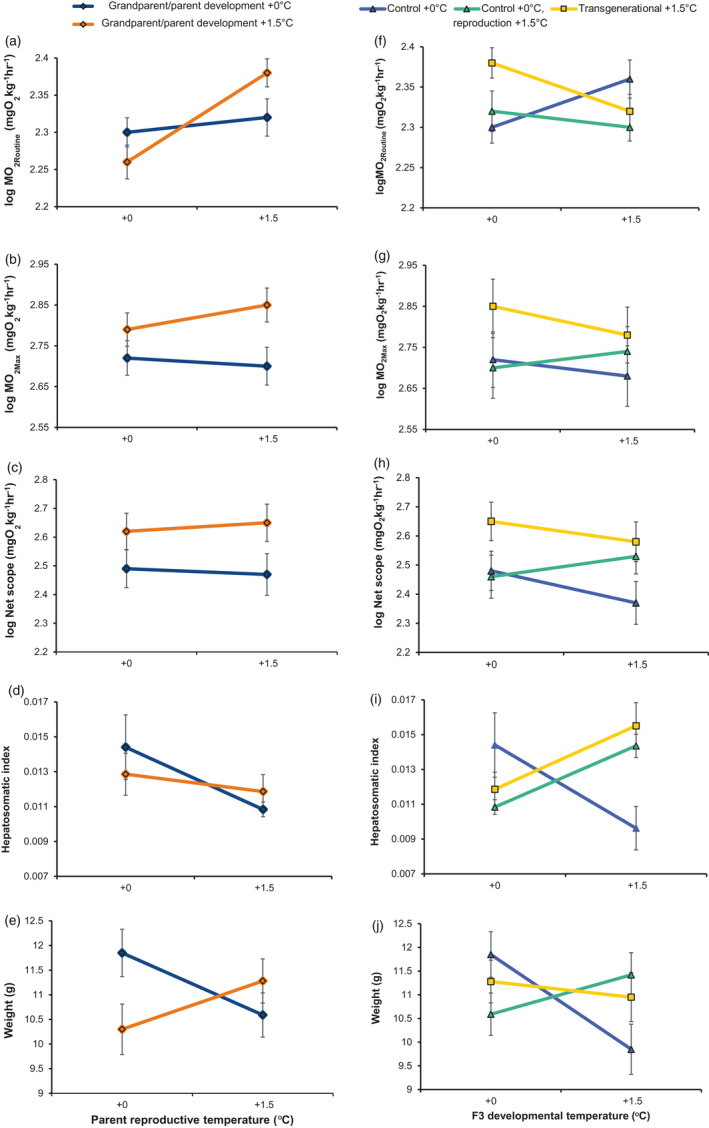
FIGURE 2.

Phenotypic effects of thermal conditions over generations. Left column displays the effect of temperature during grandparent and parent developmental conditions (F1–F2) and parent reproductive conditions on F3 MO2Routine (a), MO2Max (b), net aerobic scope (c), hepatosomatic index (HSI) (d), and body condition: weight for a given standard length (SL) (e), when F3 generation develops at +0°C control conditions (estimated marginal means ±SE). The right column shows the effect of parental reproductive conditions and F3 developmental conditions on phenotypic traits (f–g) for fish from Control +0°C, Control +0°C/reproduction at +1.5°C, and Transgenerational +1.5°C lines
