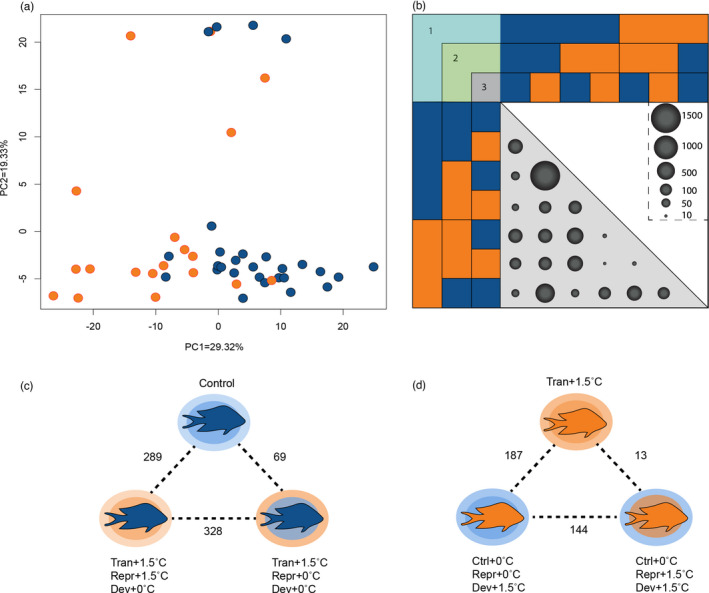
FIGURE 3.

Differential gene expression for F3 fish. (a) Principal Coordinate Analysis (PCoA) of F3 juveniles based on 459 differentially expressed genes (DEGs) between Control (blue) and +1.5°C (orange) developmental conditions, excluding DEGs from grandparental/parental and reproductive temperatures. Developmental temperature of F3 was the biggest axis of differentiation for RNA‐Seq analyses (PC1 = 29.32%), while the second axis is driven by individuals with mismatch between parental reproduction and development (PC = 19.33%; all treatments depicted in Figure S1). (b) DEGs for the pairwise comparisons of F3 juveniles. Numbers on the top‐left corner represent the conditions at different stages: grandparental/parental development (1), parental reproduction (2), and F3 development (3). The size of the circles is proportional to the number of genes significantly differentiated between comparisons (p < 0.01). (c) DEGs between Control +0°C (top), Transgenerational +1.5°C/reproduction +0°C/development +0°C (lower right), and Transgenerational +1.5°C/reproduction +1.5°C/development +0°C (lower left). The color of the fish represents the F3 developmental condition, the smaller circle represents the conditions during parental reproduction, and the larger circle represents the developmental conditions of grandparents/parents. (d) DEGs between Transgenerational +1.5°C (top), Control +0°C/reproduction +1.5°C/development +1.5°C (lower right), and Control +0°C/reproduction +0°C/development +1.5°C (lower left)
