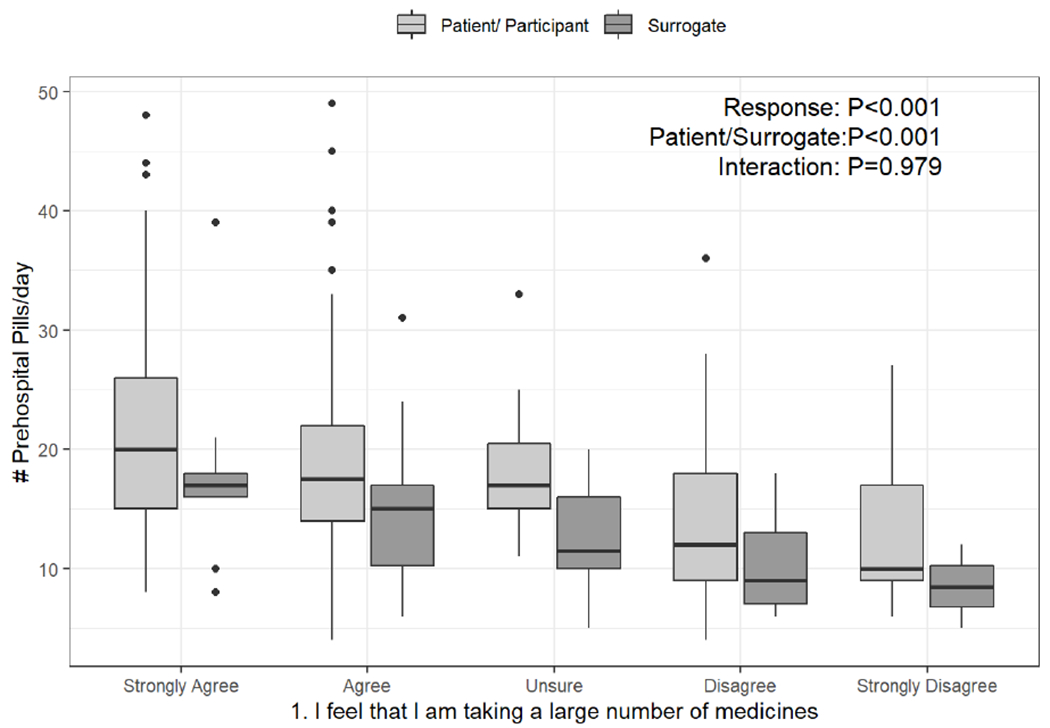
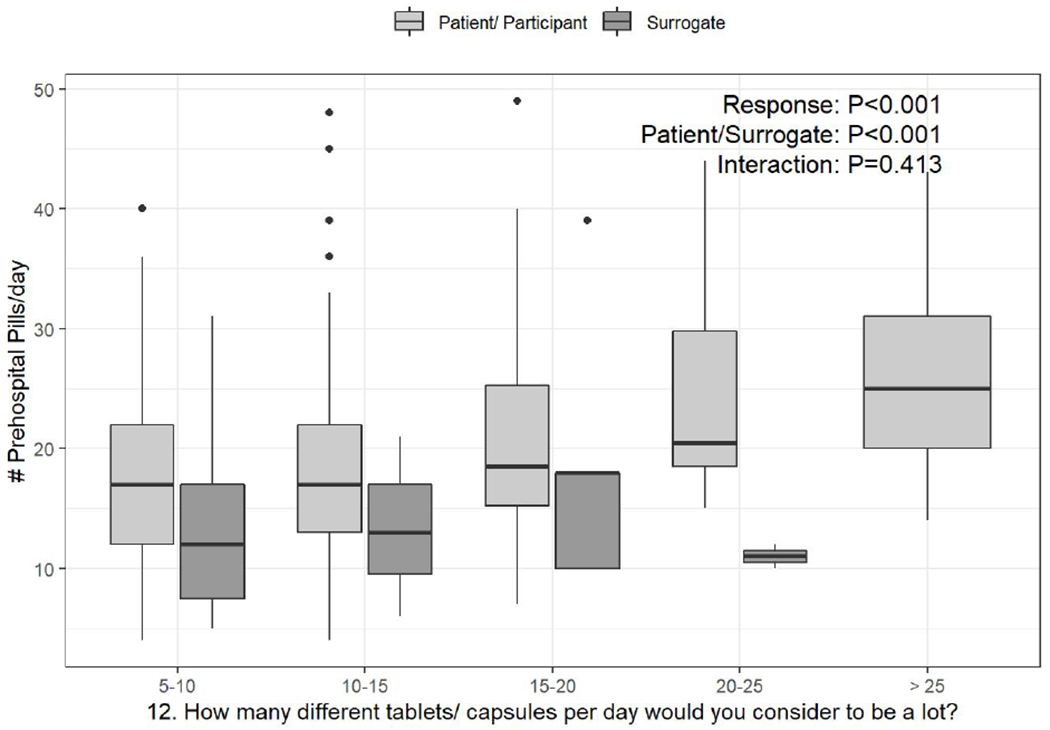
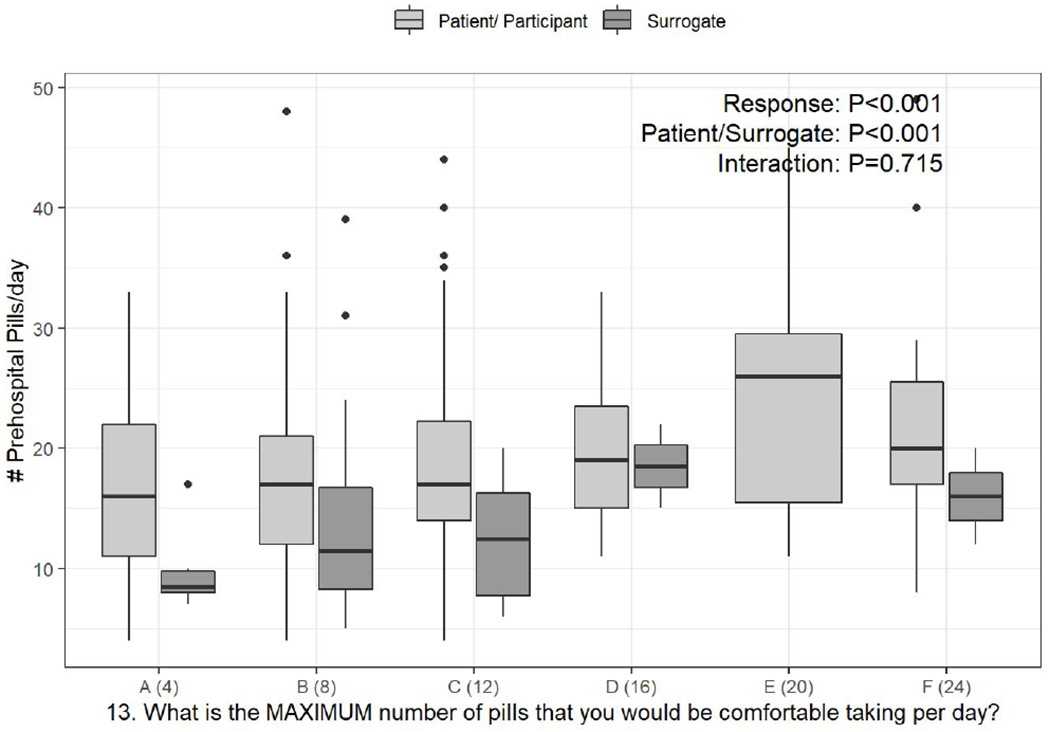
Figures 1.


a-c. Box-and-whisker plots of the counts of pre-hospital pills per day, stratified by response to PATD questions 1, 12, and 13 and whether the survey was completed by the patient or surrogate. Linear regression was used to test the associations of daily pill count versus PATD response, patient/surrogate status, and their interaction (i.e., is the association between pill count and PATD response different for patients versus surrogates?).
Categories presented on the X-axis are the response categories participants were provided from the original version of the PATD.
