FIGURE 1.

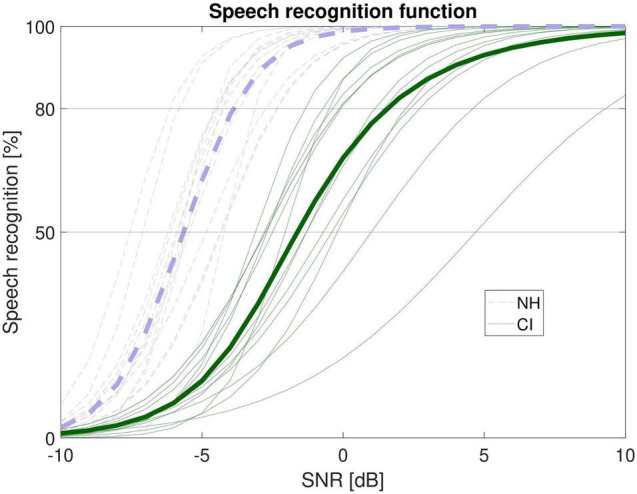
Estimated speech recognition functions for the CI recipients (green) and the NH listeners (violet). Thin lines show individual functions, bold lines show the group mean. SNR = signal-to-noise ratio.

Estimated speech recognition functions for the CI recipients (green) and the NH listeners (violet). Thin lines show individual functions, bold lines show the group mean. SNR = signal-to-noise ratio.