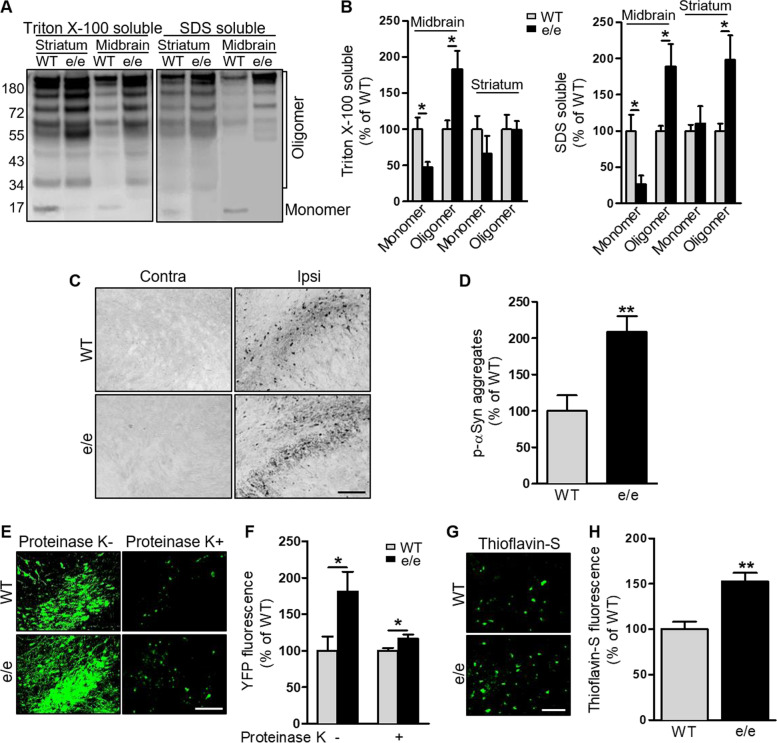
Fig. 1.
MC1R disruption exacerbates synucleinopathies in the nigrostriatal pathway in an αSyn AAV mouse model. MC1Re/e and WT mice were injected unilaterally with human WT αSyn AAV into the SN and sacrificed 8 weeks later: A Immunoblot of human αSyn species in Triton X-100-soluble and -insoluble SDS-soluble fractions in ipsilateral ventral midbrain and striatum and B quantification of αSyn monomers and oligomers. n = 3 mice/group. Measurements were normalized by dividing values by the mean of WT and multiplying by 100. One-way ANOVA followed by Tukey's post hoc test. C p-αSyn staining and D quantification of p-αSyn aggregates in the ipsilateral SN. n = 3 mice/group. Measurements were normalized by dividing values by the mean of WT and multiplying by 100. Two-tail Student’s t-test. Scale bar, 50 µm. MC1Re/e and WT mice were injected unilaterally with BiFC human WT αSyn AAV into the SN and sacrificed 8 weeks later: E VenusYFP fluorescence before and after proteinase K treatment and F quantification of venusYFP fluorescence density in the ipsilateral SN. n = 4 mice/group. Measurements were normalized by dividing values by the mean of WT and multiplying by 100. One-way ANOVA followed by Tukey's post hoc test. Scale bar, 50 µm. G Thioflavin-S staining and H quantification of thioflavin-S fluorescence density in the ipsilateral SN. n = 4 mice/group. Measurements were normalized by dividing values by the mean of WT and multiplying by 100. Two-tail Student’s t-test. Scale bar, 50 µm. *P < 0.05, **P < 0.01

