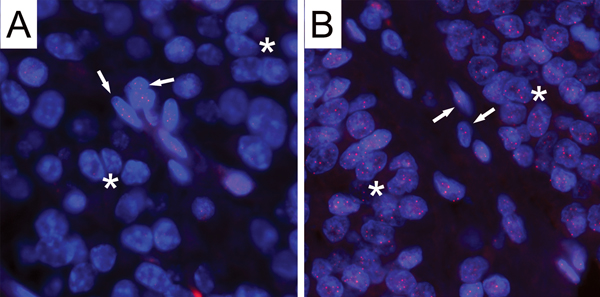
Figure 1. Telomere length analysis by FISH in pituitary adenomas.

Two representative examples of cases showing either short or normal telomere lengths in tumor cells are shown. (A) This case shows strikingly diminished telomere signals in tumor cells (asterisks) as compared to the entrapped non-neoplastic cells (arrows). (B) This case displays comparable telomere intensities in tumor cells (asterisks) with those observed in the entrapped non-neoplastic cells (arrows). In both images, the DNA is stained with DAPI (blue) and telomere DNA is stained with the Cy3-labeled telomere-specific peptide nucleic acid probe (red). It is noteworthy that the centromere DNA, stained with the FITC-labeled centromere-specific peptide nucleic acid probe, has been omitted from the image to emphasize the differences in telomere lengths. Original magnification, × 400.
