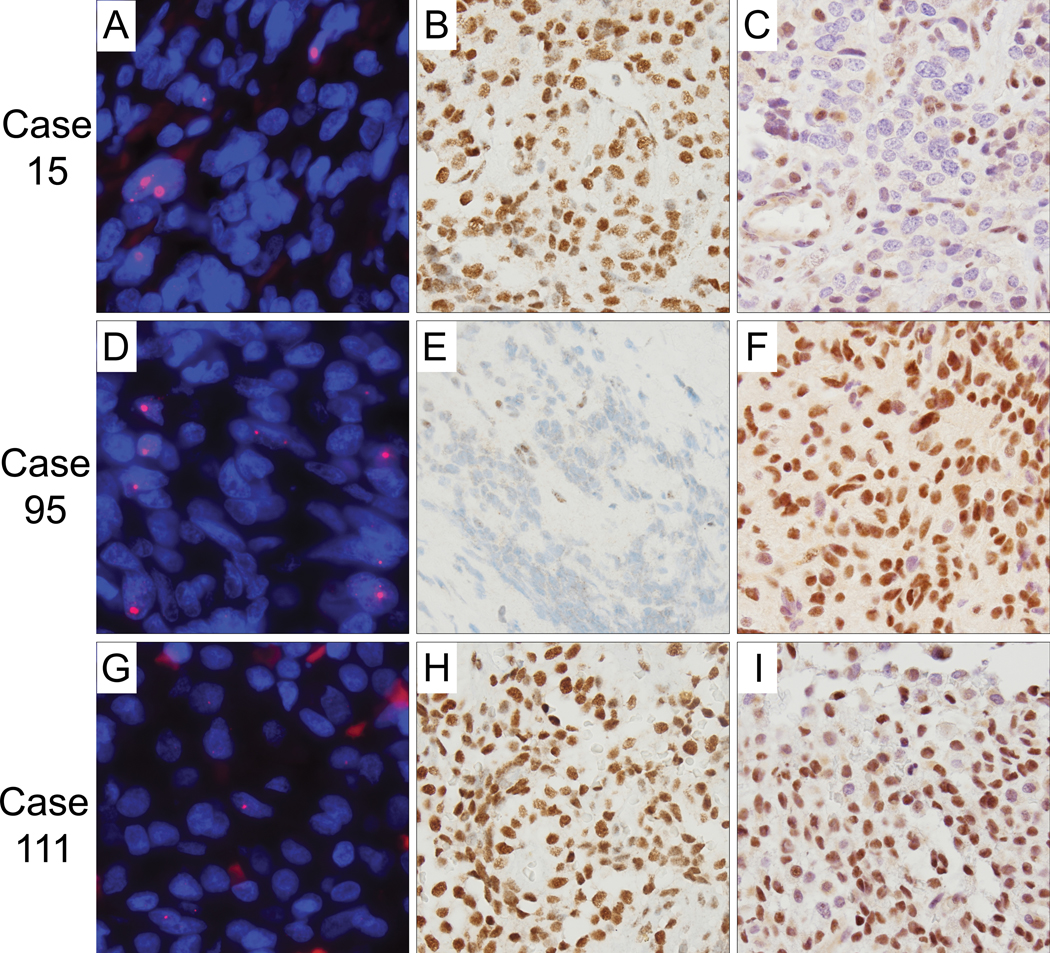
Figure 2. ALT-positive pituitary adenomas and ATRX and DAXX immunostaining.

Representative regions of the three cases (15, 95, 111) are shown. (A,D,G) Representative images of ALT-positive cases displaying ultrabright telomeric FISH signals as indicative of ALT. The DNA is stained with DAPI (blue) and telomere DNA is stained with the Cy3-labeled telomere-specific peptide nucleic acid probe (red). (B,E,H) Case 95 shows tumor cell-specific loss of nuclear ATRX expression, whereas cases 15 and 111 display intact ATRX nuclear expression. (Original magnification ×400). (C,F,I) Case 15 shows tumor cell-specific loss of nuclear DAXX expression, whereas cases 95 and 111 display intact DAXX nuclear expression. For all images presented - original magnification, × 400.
