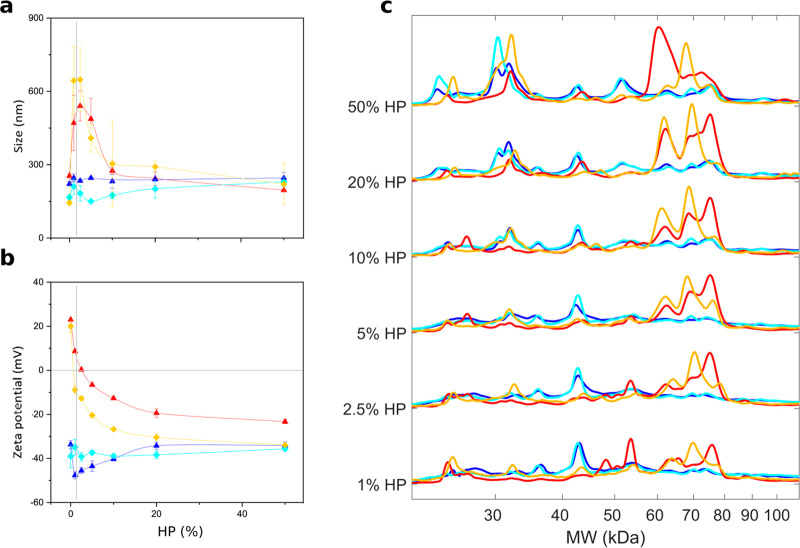
Figure 3.
Characterization of lipoplex-protein complexes as a function of protein concentration. Size (panel a) and zeta potential (panel b) of lipoplex-protein complexes prepared from CL1 and CL2 as a function of human plasma (HP) percentage (%). As PLs are positively charged systems, PL-protein complexes exhibit the typical features of cationic-anionic assemblies, i.e., re-entrant condensation and charge inversion at the isoelectric point. On the other side, the size of the DDL-protein complexes is poorly affected by HP and zeta potential tends to assume similar values. Vertical gray lines indicate the inversion point where PL-protein complexes undergo massive aggregation (panel a) caused by charge neutralization (panel b). (c) Molecular weight (MW) distributions of protein patterns bound to lipoplexes as a function of HP %. While protein patterns of DDL1- and DDL2-protein complexes were almost superimposable up to HP = 20%, those of PL1- and PL2-protein complexes were clearly distinguishable over the protein range especially between 45 and 80 kDa. Color code: DDL1 (blue), DDL2 (cyan), PL1 (red), PL2 (gold).

