Fig. 2.

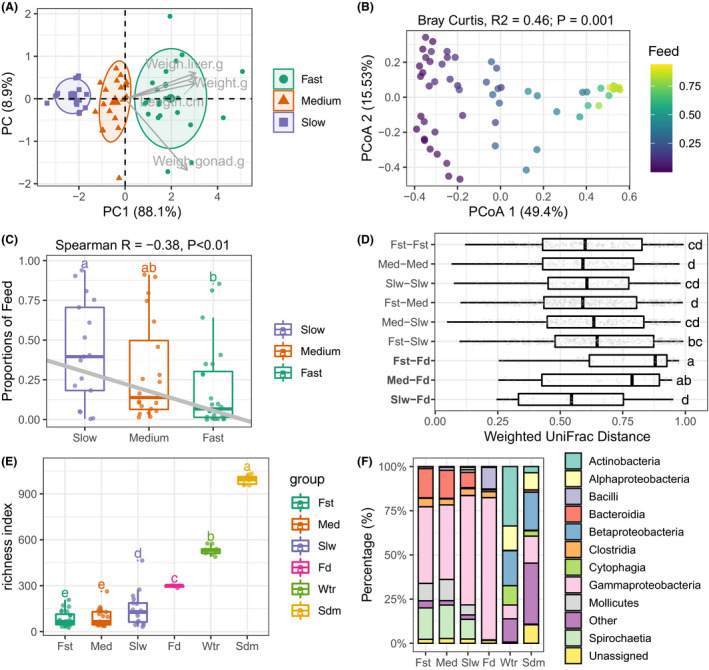
Community structure of fugu gut microbiota are correlated with feed source signal and host body mass.
A. Two‐dimensional scatter plot of all fish individual based on principal component analysis (PCA) of four body mass metrics. The grey arrow points showed the correlated body mass measures. Three optimal groups namely ‘fast’, ‘medium’ and ‘slow’ were identified by K‐mean clustering followed by Gap statistic. A normal data ellipse for each group was drawn at confidence level of 0.68.
B. Principal coordinate analysis of gut microbiota based on Bray–Curtis distance. Percentage of explained variance and statistics (PERMANOVA test with 999 permutations) were shown as figure title. Each community point was coloured by the proportion of feed source signal.
C. SourceTracker‐estimated proportions of feed bacteria for each gut community grouped by host body mass. Grey line denotes the linear regression of feed proportions and fugu body mass (Spearman’s Rank), statistics was indicated in figure title.
D. Boxplot of group‐paired weighted UniFrac distances showing the dissimilarities between gut and feed were reduced in slow growth fugu (Slw‐Fd) comparing to fast growth one (Fst‐Fd).
E. Species richness (Numbers of observed ESVs) among six groups of bacterial community. For each box in (C–E), the bold bar denote medians; the height of box denotes the interquartile range (25th percentile–75th percentile); the whiskers mark the values range within 1.5 times interquartile. Lower‐cased letters denote statistical significance reported by Mann–Whitney U‐test at confidence level of 0.95.
F. Stackbars showing the relative abundance of top‐10 bacterial classes across six groups of community. Bacterial class which has a lower relative abundance were grouped into ‘Other’. The detailed results of replicated samples were shown in Fig. S7.
