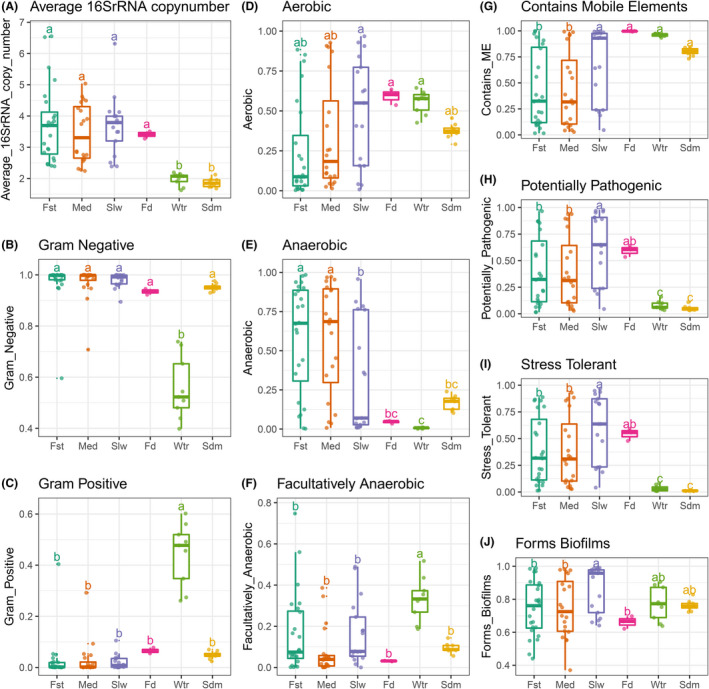
Fig. 3.

Phenotype inference of bacterial communities from the fugu rearing ecosystems. Estimated relative abundances for each indicated bacterial phenotype was compared across different sample groups.
A. Averaged 16S rRNA copy numbers were compared among sample sites of bacterial communities. Points denote the mean copy number calculated from a given bacterial community. The following organism‐level phenotypes were inferred by BugBase. Relative abundances of bacteria differing in Gram staining were shown in (B) for Gram negative and (C) for Gram positive. Relative abundances of bacteria differing in oxygen tolerance phenotypes were shown in (D) for Aerobic, (E) for Anaerobic and (F) for Facultatively Anaerobic. Relative abundances of bacteria differing in latent pathogenicity phenotypes were shown in (G) for containing mobile elements, (H) for potentially pathogenic, (I) for oxidative stress tolerance and (J) for biofilm formation. See Fig. S9 for the related taxa contributions of the relative abundance of bacteria possessing each phenotype. For each box, the horizontal bold bar denote medians; the height of box denotes the interquartile range (25th percentile–75th percentile); the whiskers mark the values range within 1.5 times interquartile. Lower‐cased letters denote groups and statistical significance reported by pairwise Mann–Whitney U‐tests with false discovery rate correction at confidence level of 0.95.
