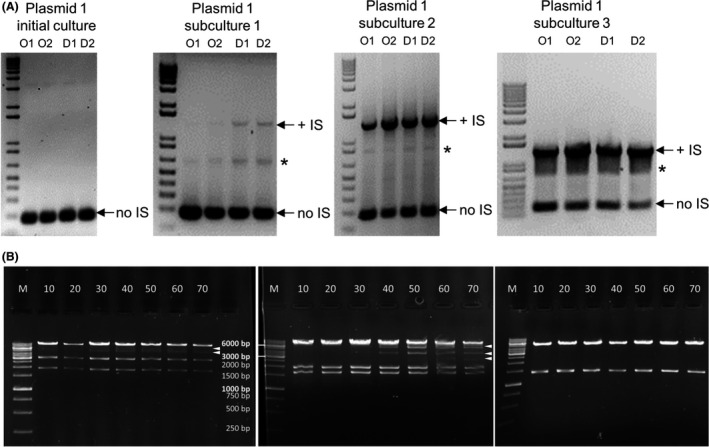
Fig. 4.

The presence of IS elements provides selective advantage to certain plasmids in E. coli DB3.1.
A. Time‐series PCR screening of plasmid 1 using primers flanking the putative IS insertion site. Single colonies of the ABRC original (O1–O2) and distribution stocks (D1–D2) were subjected to three rounds of subculturing, with appropriate aliquots taken out and used for the analysis. A PCR product of ~1400 bp indicates the presence of an IS insertion (+IS) while a product of ~200 bp indicates the absence of IS insertion (no IS). A non‐specific PCR product is marked with an asterisk.
B. Changes in the restriction pattern of various plasmids propagated in E. coli DB3.1. The numbers on top of each gel photo represent the number of generations the culture had gone through at the time of sampling. Left: plasmid 27, digested with EcoRI + NheI. Expected bands: 9491 bp, 3050 bp and 1862 bp. An extra band appears between 3 kbp and 6 kbp beginning at generation 30, marked by an arrowhead. Centre: plasmid 44, digested with EcoRI + HindIII. Expected bands: 7823 bp, 1946 bp and 1637 bp. Extra bands appear beginning at generation 40, marked by arrowheads. Right: plasmid 46, digested with EcoRI + EcoRV. Expected bands: 5447 bp and 1399 bp. Only expected bands are visible in all lanes. M: GeneRuler 1 kbp DNA Ladder (Thermo Scientific).
