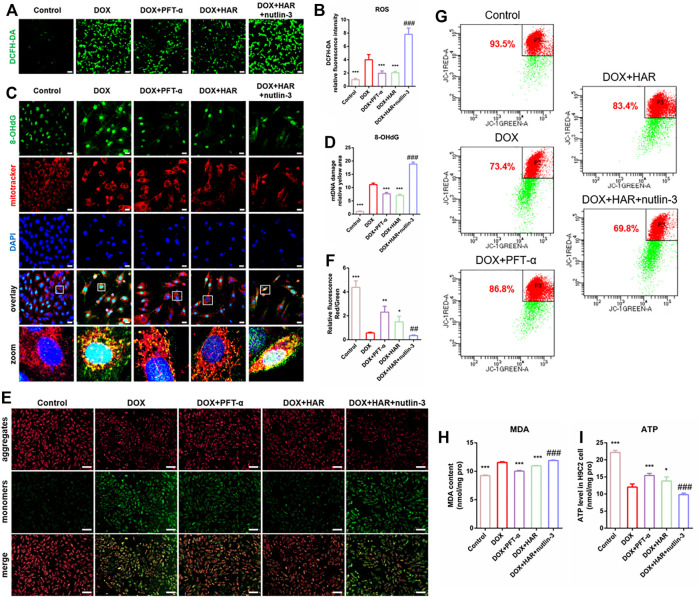
FIGURE 5.
HAR maintained mitochondrial health by suppressing p53 in vitro. (A–D) Representative images and quantitative analysis of ROS in H9C2 cells measured by staining with DCFH-DA and mtDNA injury measured by costaining with 8-OhdG (DNA damage marker) and MitoTracker (n = 6). Scale bars: 100 and 25 μm. (E–G) Representative images and quantitative analysis of mitochondrial membrane potential in H9C2 cells measured by staining with JC-1 and detection under a fluorescence microscope and fluorescence-activated cell sorting (n = 4–6). Scale bar: 100 μm. (H) MDA was quantified in H9C2 cells to evaluate the degree of damage to intracellular membrane structures (n = 6). (I) The intracellular ATP content in various groups of H9C2 cells. ATP content reflects mitochondrial productivity. *p < 0.05, **p < 0.01, ***p < 0.001 vs. DOX group (n = 3–6). ## p < 0.01, ### p < 0.001 vs. (DOX + HAR) group. The data are shown as the mean ± s.d.

