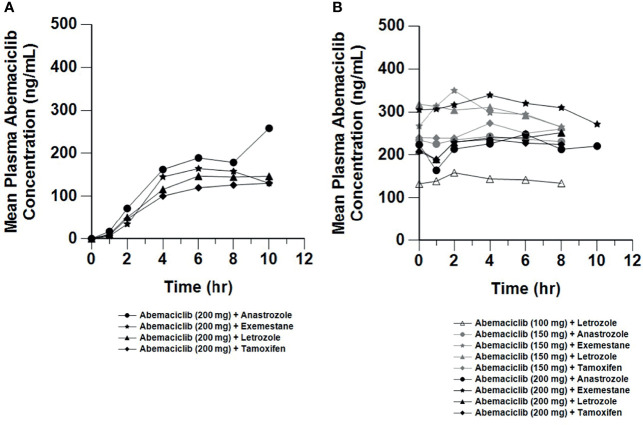
Figure 4.
Mean Plasma Concentrations of Abemaciclib Following Single and Multiple Doses. Mean plasma concentration vs. time profiles of abemaciclib following oral administration of abemaciclib with combination therapies after a single abemaciclib dose (200 mg; (A) and on Cycle 2 Day 1 at steady state after multiple twice daily abemaciclib doses (100 to 200 mg; (B). Plasma concentration data for abemaciclib and metabolites were available from 67 patients (n=20, letrozole; n=16, anastrozole; n=16, tamoxifen; n=15, exemestane). hr, hour.

