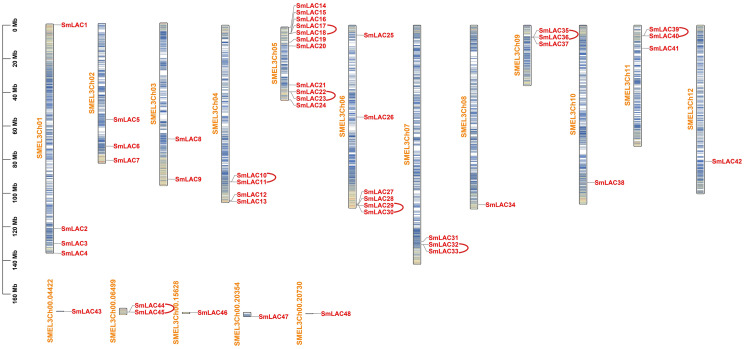
Figure 1. Chromosomal distributions and tandem replication analysis of SmLACs in eggplant.
Scale bar on the left indicates chromosome lengths (Mb). Columns with different colors denote gene density on each chromosome. Red represents the distribution of different SmLACs on each chromosome, yellow represents the number of each chromosome, and arcs in red indicate tandem replication genes existing in laccase members from eggplant.

