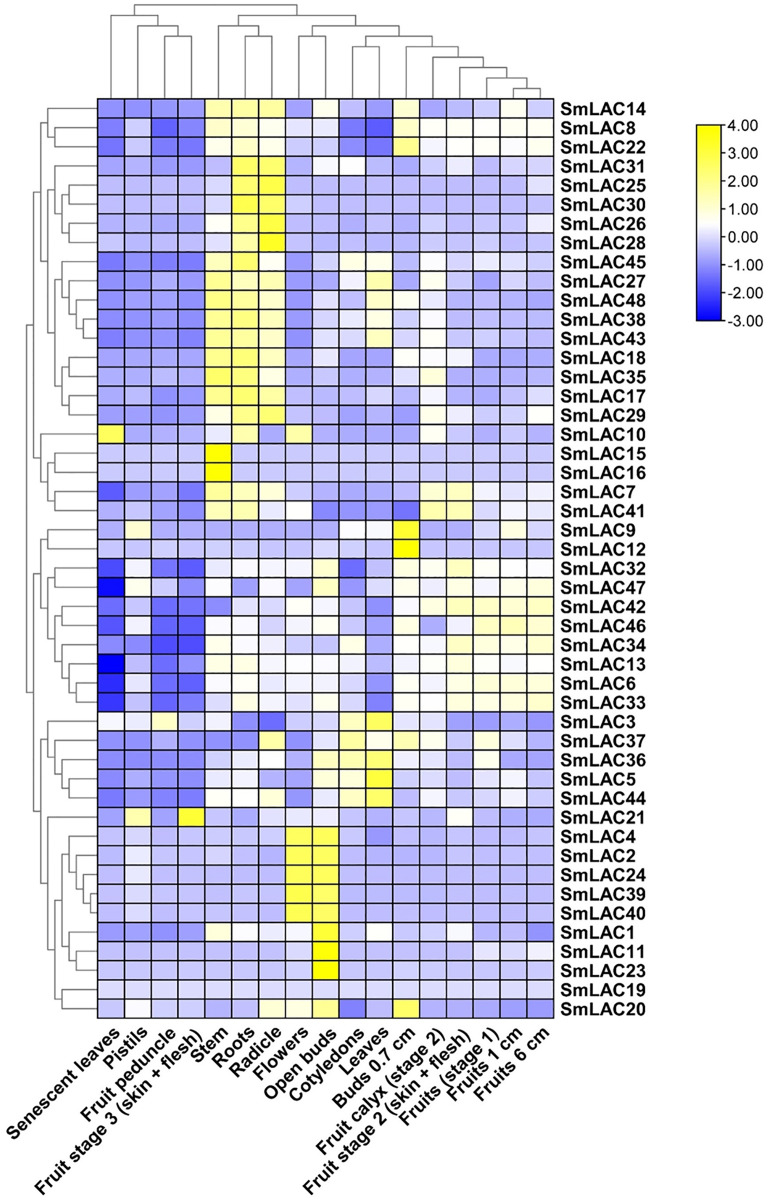
Figure 5. Heat map representation of SmLACs in various development stages.
The names of the genes were written on the right of the heat map. The bar at the right of the heat map represented relative expression values, and the relative expression values were log2 (FPKM+1). So that the relatively low expression values or relatively high expression values were colored dark blue or yellow with increasing intensity, respectively. But no expression values were colored white.

