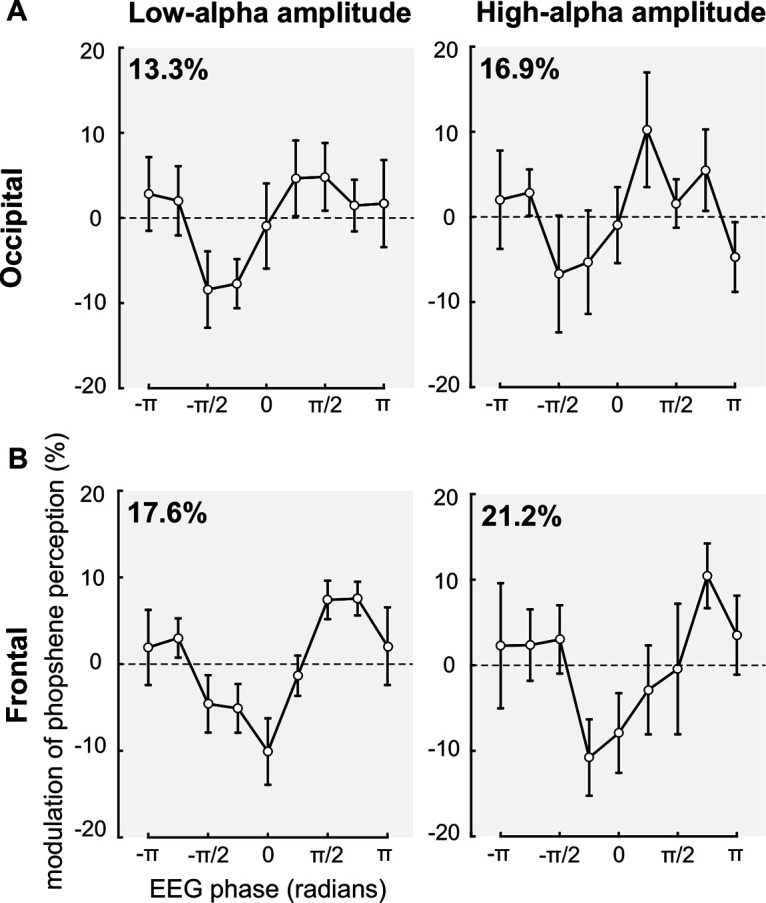
Figure 5.

The phase π/2 of the α cycle is the optimal phase for phosphene perception. Left panels, Phosphene perception computed for nine phase bins (expressed in radians), normalized according to the average phosphene perception, and averaged across the nine participants and electrodes of interest, for low-α amplitude trials. Right panels, For high-α amplitude trials. Error bars, SEM. A, Phosphene perception is plotted according to the instantaneous phase at −77 ms, 10.7 Hz, for the occipital ROI. Phosphene perception oscillates along with the α phase (two-way repeated-measures ANOVA: F(1,8) = 2.117, p = 0.0467, η2 = 20.93), with an optimal phase for phosphene perception at the phase π/2 of the α cycle. The percentage of variance explained by the phase is more important for high-α (16.9% difference between π/2 and –π/2) compared with low-α (13.3%) amplitude trials. B, Phosphene perception is plotted according to the instantaneous phase at −40 ms, 10.7 Hz for the frontal ROI. Phosphene perception oscillates along with the α phase (two-way repeated-measures ANOVA: F(1,8) = 3.360, p = 0.0028, η2 = 29.58), with an optimal phase for phosphene perception at the phase π/2 of the α cycle. The percentage of variance explained by the phase is more important for high-α (21.2% difference between π/2 and –π/2) compared with low-α (17.6%) α amplitude trials.
