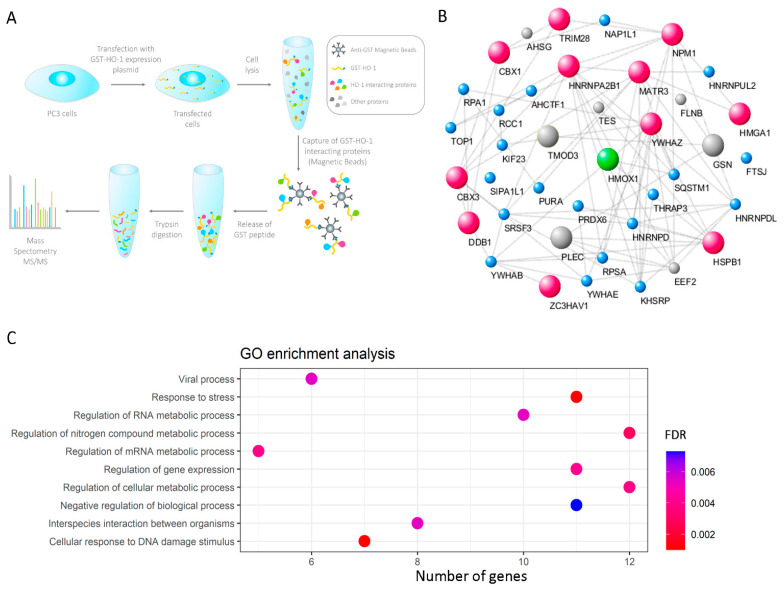
Figure 1.
Construction of the HO-1 interactome in PCa cells. (A) Simplified schematic workflow of the construction of the HO-1 interactome in PC3 cells. GST-HO-1 immunoprecipitation assays were performed from PC3 cell extracts that had been previously treated with H2O2 (200 μM, 1 h). For the LC ESI-MS/MS analysis, peptides were desalted and concentrated on a C18 resin. Tandem mass spectra were extracted using the Xcalibur software. All MS/MS samples were analyzed by using Mascot. (B) Interactions network for the GST-HO-1 binding proteins. The network was built with Cytoscape 3.7.0. using the interactions data obtained with STRING, using a minimum combined interaction score of 0.400. The protein size increases proportionally to the PSMs obtained in the LC ESI-MS/MS analysis. Proteins in pink are proteins identified with PSM > 2 and previously reported in the cell nucleus. (C) Gene ontology (GO) (biological processes) categories significantly dysregulated for genes encoding for HO-1 interactor proteins with nuclear localization. The color gradient shows the adjusted p-value. FDR = false discovery rate.

