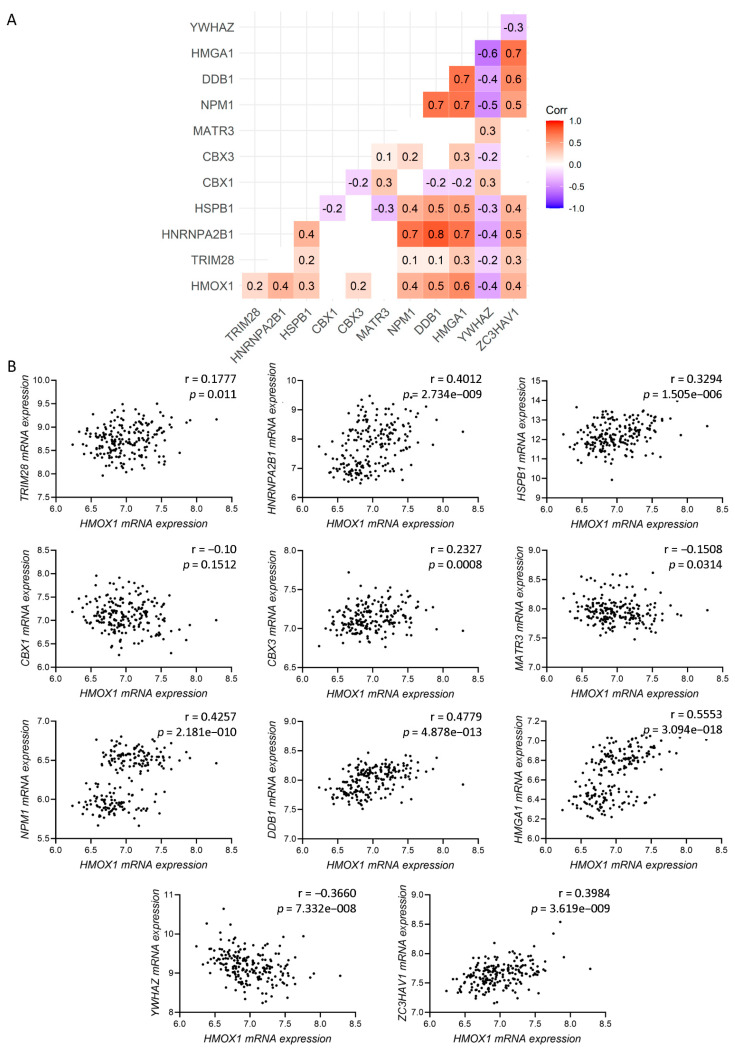
Figure 2.
Gene correlation. (A) Pairwise Spearman correlation matrix analysis between HMOX1 and all of the genes encoding for the HO-1 interactor proteins which were previously reported in the cell nucleus (TRIM28, HNRNPA2B1, HSPB1, CBX1, CBX3, MATR3, NPM1, DDB1, HMGA1, YWHAZ, and ZC3HAV1). Rounded Spearman correlation values are included inside each color box. Color scale ranges from blue (r = −1) to white (r = 0) to red (r = 1). (B) Spearman correlation analysis for HMOX1 and the genes encoding for the HO-1 interactor proteins, which were previously reported in the cell nucleus (TRIM28, HNRNPA2B1, HSPB1, CBX1, CBX3, MATR3, NPM1, DDB1, HMGA1, YWHAZ, and ZC3HAV1). Statistical significance was set at p < 0.05.

