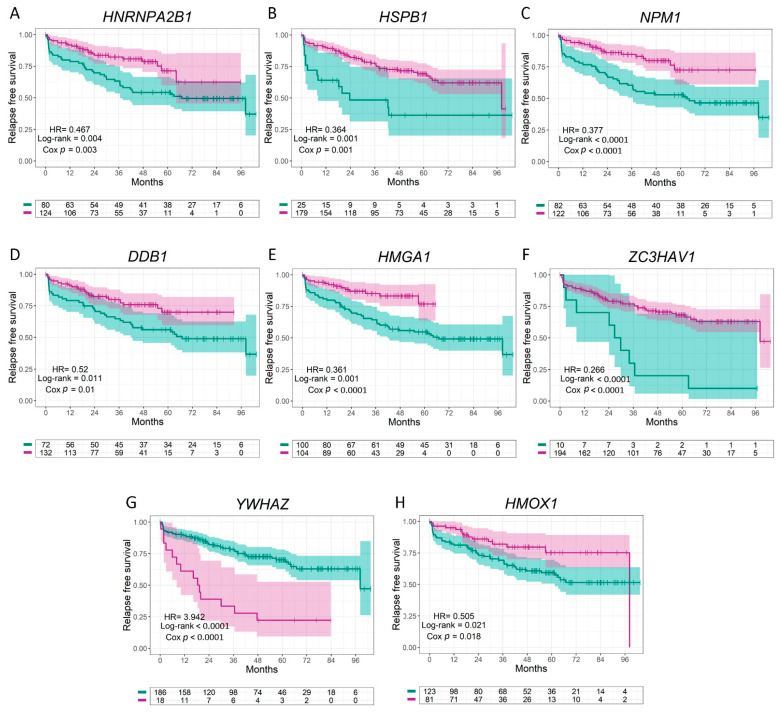
Figure 3.
Relapse-free survival (RFS) of PCa patients using the Ross–Adams dataset, GSE70770, n = 206. (A–H) Kaplan–Meier curves for RFS of PCa patients segregated based on the gene expression levels for HNRNPA2B1 (A), HSPB1 (B), NPM1 (C), DDB1 (D), HMGA1 (E), ZC3HAV1 (F), YWHAZ (G), and HMOX1 (H). RFS of patients with high (purple lines) vs. low (green lines) expression for each gene. HR = hazard ratios (95% confidence interval). All comparisons consider low expression patients as the reference group. Cox p = Cox proportional hazard model p-value. Statistical significance was set at Cox p < 0.05.

