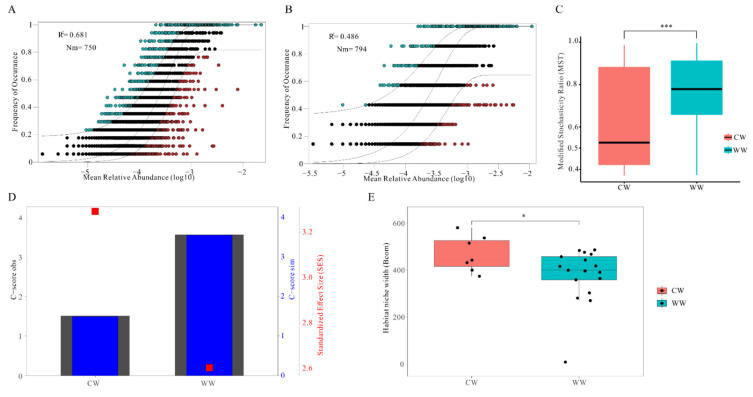
Figure 4.
Ecological processes shaping gut microbiota communities in CW and WW white-lipped deer. (A,B) Predicted occurrence frequencies for WW and CW represent gut microbiota communities from WW groups. Solid blue line indicates best fit to neutral community model (NCM), dashed blue line indicates 95% confidence intervals around NCM prediction. OTUs that occur more or less frequently than predicted by NCM are shown in green and red, respectively. R2 represents fit to this model. (C) Evaluation of the relative significance of determinate and stochastic process between CW and WW. If modified stochasticity ratio (MST) >0.5, deterministic processes dominate; if MST < 0.05 stochastic process dominate (Not significant, p > 0.05; * 0.01 < p < 0.05; *** p < 0.01). (D) C-score index using null models. Values of observed C-score ((C-score obs) = simulated C-score (C-score sim)) indicate random co-occurrence patterns. Standardized effect sizes -2 and > 2 represent aggregation and segregation, respectively. (E) Comparison of mean habitat niche breadth for CW and WW groups (Not significant, p > 0.05; * 0.01 < p < 0.05; *** p < 0.01).

