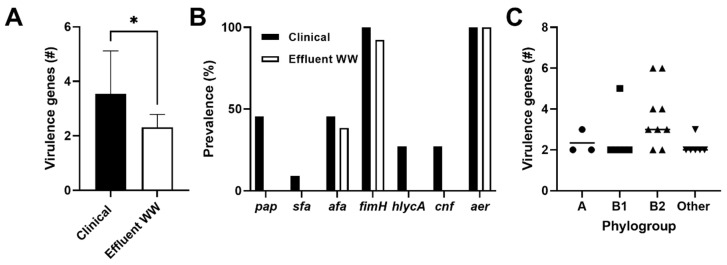
Figure 4.
Virulence genes amongst CTX-resistant E. coli populations. (A) The mean number of virulence genes ± standard deviation identified among clinical E. coli (n = 11, black bars) and treated WW effluent populations (n = 16, white bars). (B) Data represents the prevalence of each virulence factor among clinical isolates (black bars) and WW treated effluents (white bars). Percent prevalence was calculated by dividing total isolates positive for each virulence factor by the total isolates from the representative source. (C) Each point represents the number of virulence genes encoded by an E. coli isolate within the major phylogroups with the bar representing the mean number of virulence genes within the corresponding phylogroup. * p = 0.0007.

