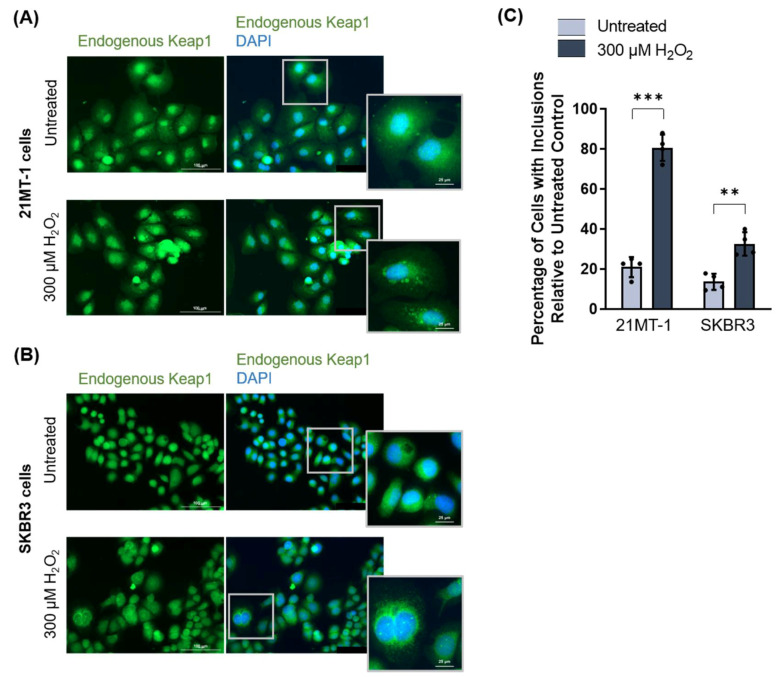
Figure 7.
Keap1 forms oxidative stress-induced inclusions in breast cancer cell lines. (A,B) Endogenous Keap1 expression in two breast cancer cell lines, 21MT-1 (A) and SKBR3 (B), treated with 300 µM H2O2 for 3 h, visualized by immunofluorescence microscopy. (C) Quantification of Keap1 inclusions following hydrogen peroxide treatment in (A,B). Means derived from three biological replicates were used during the analysis. Means were analyzed using one-way ANOVA followed by Tukey’s post hoc test. Data are expressed as mean ± SD. p < 0.05 was considered statistically significant; ** p < 0.01, *** p < 0.001.

