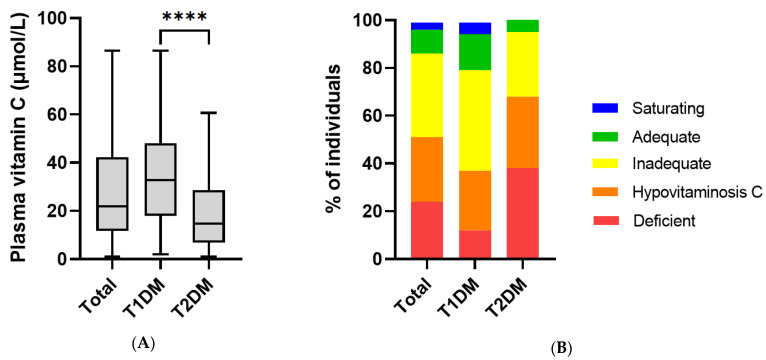
Figure 2.
Vitamin C status in patients with T1DM and T2DM: (A) box plots show median, borders the 25th and 75th percentiles and whiskers the range; **** p < 0.0001 (Mann–Whitney U test). (B) Vitamin C categories: deficient ≤ 11 µmol/L; hypovitaminosis C ≤ 23 µmol/L; inadequate < 50 µmol/L; adequate ≥ 50 µmol/L; saturating ≥ 70 µmol/L.

