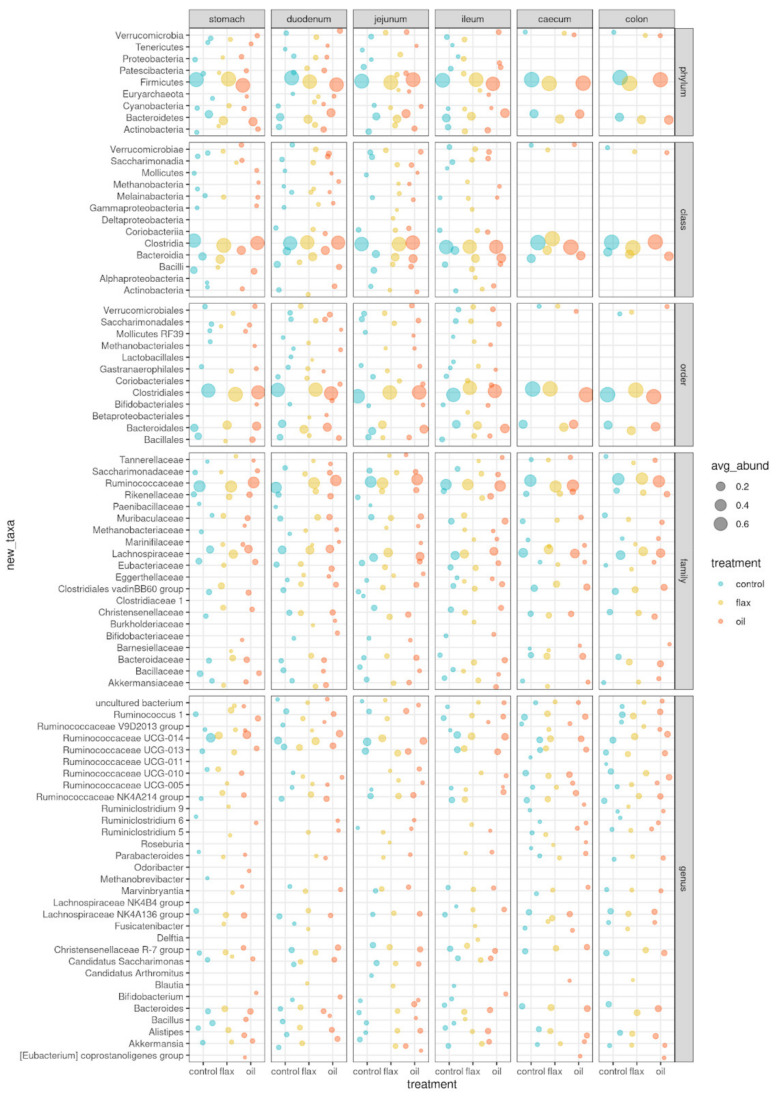
Figure 2.
Bubble chart of relative abundances of all taxa (≥1%) in the gut microbiota of the three groups of rabbits, grouped by taxonomic level (from phylum to genus). Control (blue = 5 rabbits), flaxseed (yellow = 5 rabbits) and fish oil (red = 5 rabbits) experimental groups. The size of the bubble is proportional to the relative abundance, with 0.2, 0.4, and 0.6 hallmarks, as shown in the legend.

