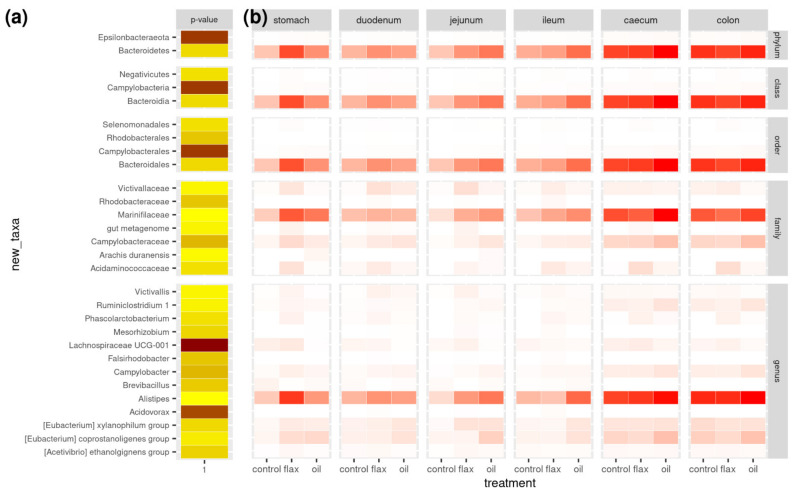
Figure 3.
Heatmap of significance and abundance of significantly different taxa. In (a), the -log(p-value) for the difference between treatments along the gastrointestinal tract is reported (p-values are in the range 10–15–0.049, from dark brown to light yellow). In (b), the relative abundances of each significant OTUs in the consecutive sections of the gastrointestinal tract of rabbits are shown (darker colors indicate higher abundance). OTUs are grouped per taxonomic level (from phylum to genus). Groups (n = 5/group): control and enriched diets supplemented with flaxseed (flax) and fish oil (oil). p-values were obtained from a linear model that included the effects of treatment and tissue within rabbit.

