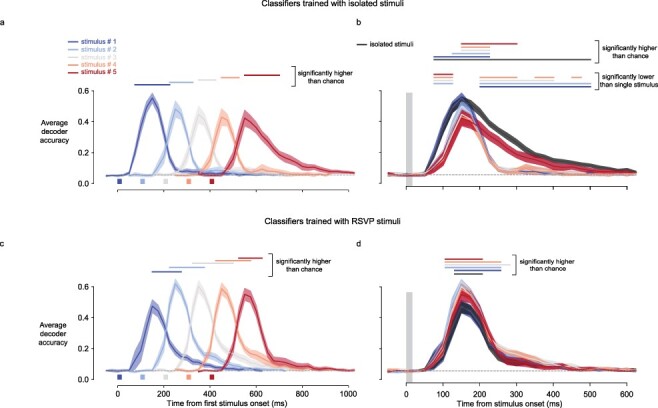
Figure 3.

Decoder accuracy as a function of time for stimuli presented in RSVP and stimuli presented in isolation. (a) Grand average decoder accuracy across the 18 accuracy levels corresponding to every stimulus. Accuracy is averaged independently for each stimulus of the RSVP sequence as a function of time since the first stimulus onset. Error bars are the standard error of the mean across the 18 stimuli. Horizontal bars above the curves indicate time points with decoder accuracy higher than chance level (P < 0.001, single-sample T-tests corrected for multiple comparisons using false discovery rate procedure). Rectangles under the curves represent the time of physical presence of the stimuli on the screen. (b) Same as in (a) but aligned to stimulus onset and adding the curve for stimuli presented in isolation (black curve). Uppermost horizontal lines display the same statistics as in (a) but adding the curve for the isolated stimuli. The other horizontal lines represent the time for which stimuli presented in the RSVP sequence are less decodable than stimuli presented in isolation (P < 0.001, dependent T-tests corrected for multiple comparisons using false discovery rate procedure). The gray vertical rectangle represents the time of physical presence of the stimuli on the screen. (c) Same as in (a) but with decoders trained with stimuli in positions 2, 3, or 4 of the RSVP sequence. (d) Same as in (b) but with decoders trained with stimuli in positions 2, 3, or 4 of the RSVP sequence
