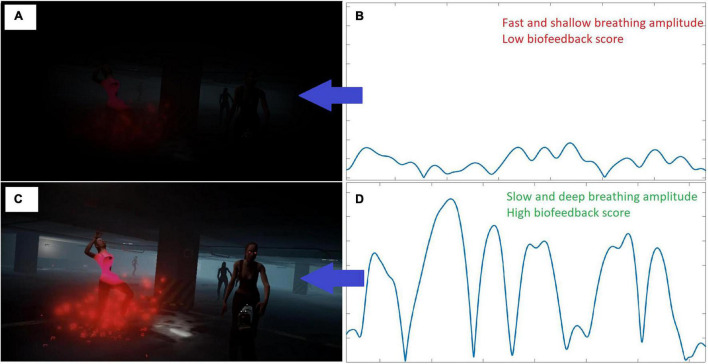
FIGURE 1.
Implementation of the biofeedback as peripheral vision modulation. The quality of the vision (on the left) was linked to the biofeedback score, calculated from the breathing speed and amplitude (on the right); (A) Vision with a biofeedback score equal to 0 (the player is not breathing at the rewarded pace); (B) example of fast and shallow breathing amplitude, corresponding to a breathing biofeedback score of 0; (C) Vision with a biofeedback score equal to 1 (maximum adherence to rewarded breathing pace) or in A-phase sessions in which online biofeedback was not presented to the player; (D) example of slow and deep breathing amplitude, corresponding to a breathing biofeedback score of 1.

