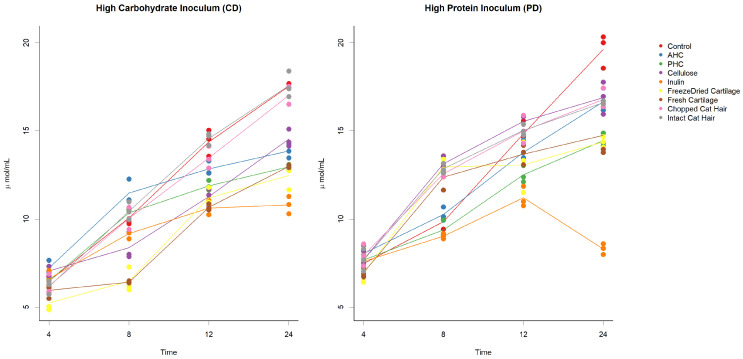
Figure 2.
Scatter plots with mean lines of ammonia concentrations. Time (hours) is along the x-axis and organic acid concentration along the y-axis (mM). Each graph depicts both high protein faecal inoculum (PD) and high carbohydrate faecal inoculum (CD) and the changes that occurred over 24 h of fermentation. Each point (coloured circle) represents an individual replicate, and each line shows the mean for each substrate. Control samples are denoted by a red line, AHC (ANZCO hydrolysed collagen) by a blue line, PHC (Peptan hydrolysed collagen) by a green line, cellulose by an orange dashed line, inulin by a purple line, freeze-dried cartilage by a yellow line, fresh cartilage by a brown line, chopped cat hair by a pink line, and intact cat hair by a grey line.

