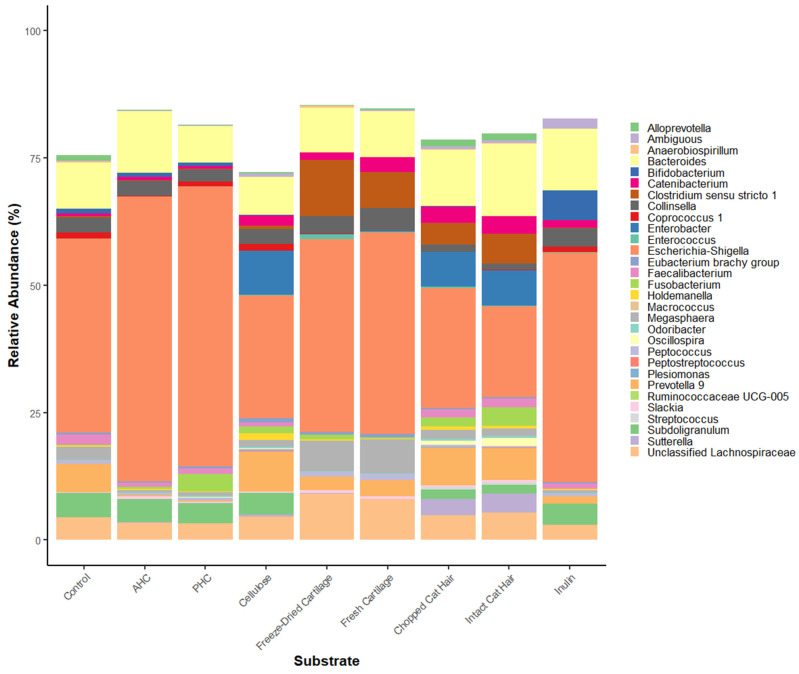
Figure 4.
Barplot of the relative abundance of the top 30 bacterial genera present at 24 h in the in vitro fermentation system of the high carbohydrate faecal inoculum (CD) according to substrate. Each colour in the bar plot represents a bacterial genus, with the size of the bar denoting their relative abundance.

