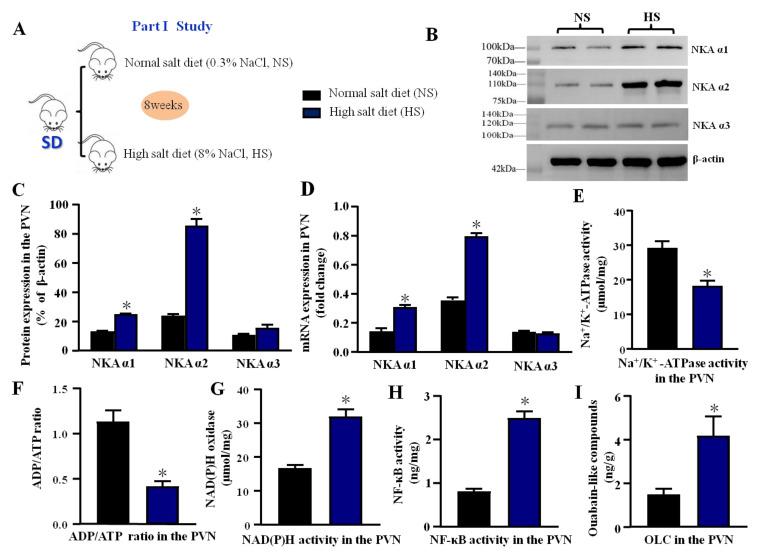
Figure 1.
Effect of high salt diet on NKA subunits, Na+/K+-ATPase, oxidative stress, and inflammation in the PVN (A) The flow charts for Part I study. (B) The representative immunoblot of NKA subunits (α1, α2, and α3) in the PVN between high salt group (HS) and normal salt group (NS). (C) Densitometric analysis of protein expression. (D) Bar graph comparing the fold change of mRNA. (E) The bar change of Na+/K+-ATPase activity. (F) ADP/ATP ratio. (G) NAD(P)H activity. (H) NF-κB activity. (I) Ouabain-like compounds (OLC) level in the PVN. Values are expressed as the mean ± SEM (n = 4–5). * p < 0.05 versus control group.

