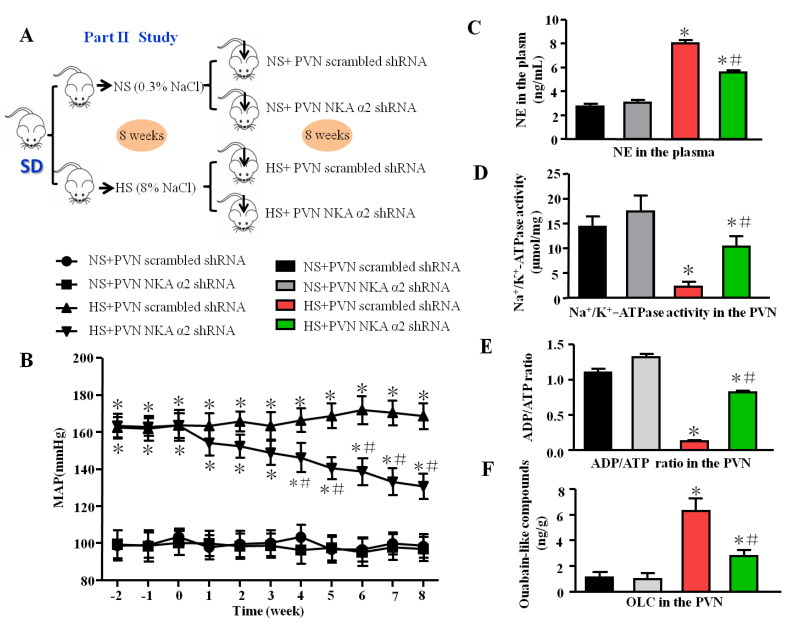
Figure 2.
Effect of decreased NKA α2 in the PVN on mean arterial blood pressure, sympathetic activity, NKA, and ADP/ATP ratio in salt-induced hypertension. (A) The flow charts for Part II study. (B) The line chart of MAP in different groups. (C) The histogram of noradrenaline (NE) in the plasma. (D) Na+/K+-ATPase activity in the PVN. (E) ADP/ATP ratio. (F) Ouabain-like compounds (OLC) level in the PVN in different groups. * p < 0.05 versus the normal salt groups (the normal salt + NKA α2 shRNA or normal salt + scrambled shRNA group); # p < 0.05, the high salt + NKA α2 shRNA group versus the high salt + scrambled shRNA group. Values are expressed as the mean ± SEM (n = 6).

