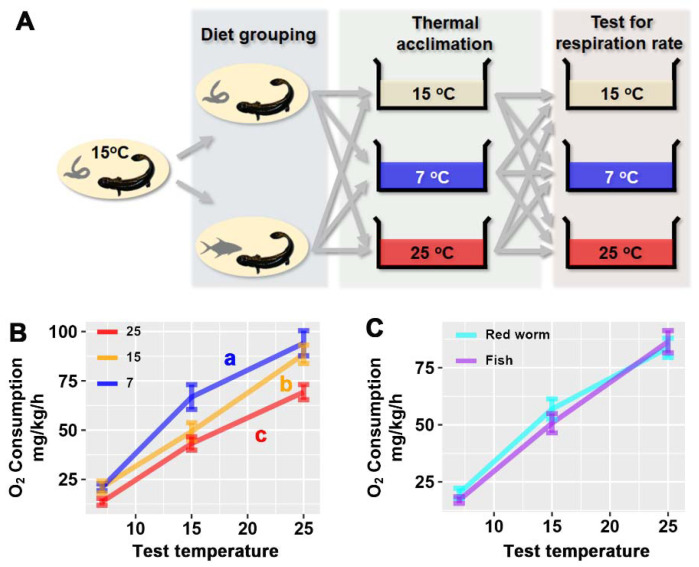
Figure 1.
Plasticity in metabolic capacity after thermal and diet acclimation. (A) Experimental design. (B) Variations between thermal-acclimated groups. (C) Variations between diet-acclimated groups. The data were analyzed by ANCOVA (test temperature as covariant) and LSD post hoc test; the results are detailed in Table 2. Different letters denote significant differences between groups.

