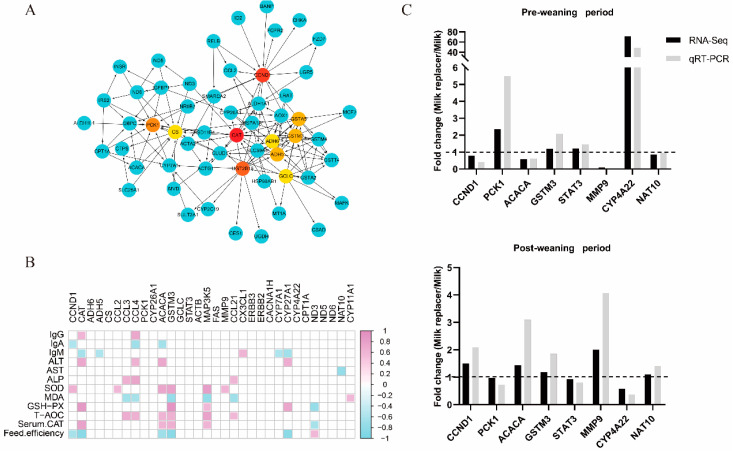
Figure 3.
Relationship between hub-DEGs and phenotypes, and verification of transcriptome accuracy. (A) The top 10 hub-genes by cytoHubba in the top 200 differentially expressed genes between two groups. Blue genes are the first-stage genes of the hub-genes; (B) Correlation analysis between the apparent indicators and differently expressed genes. The pink color represents a positive correlation, and the blue color represents a negative correlation. The red to blue scale bar running from 1.0 to −1.0 represents r = 1.0 to −1.0. The blank represents p > 0.05. Serum immunoglobulin (Ig), glucose (GLU), triacylglycerol (TG), aspartate aminotransferase (AST), glutamic-pyruvic transaminase (ALT), alkaline phosphatase (ALP), total protein (TP), albumin (ALB), globulin (GLB), total antioxidant capacity (T-AOC), superoxide dismutase (SOD), glutathione peroxidase (GSH-PX), malondialdehyde (MDA), serum catalase (Serum CAT); (C) Validation of eight differentially expressed genes using quantitative real-time PCR (qRT-PCR). During pre- and post-weaning period, genes were validated. The mRNA level of each gene was normalized to that of β-actin (n = 4). The ratio of expression in livers of milk replacer calves to milk (Milk replacer/Milk) via RNA-Seq and RT-PCR is shown (n = 1).

