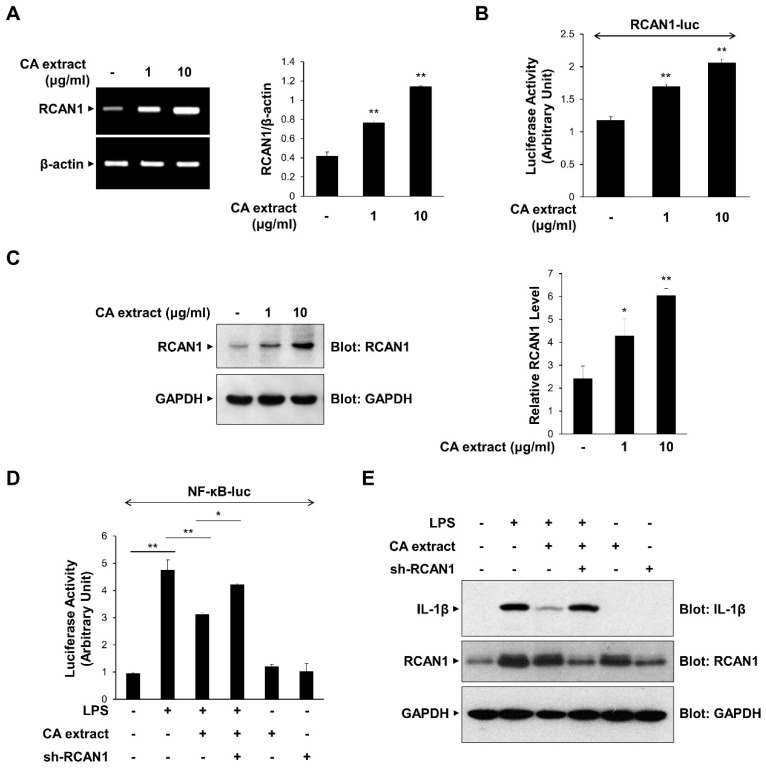
Figure 3.
Upregulation of RCAN1 expression in response to CA extract. (A) RAW264.7 cells were treated with CA extract at the indicated concentrations. The mRNA levels of RCAN1 and β-actin were measured by RT-PCR and then quantified. (B) RAW264.7 cells were transfected with the RCAN1-luciferase reporter vector. After 24 h, cells were treated with the CA extract for 3 h, and cell lysates were analyzed for luciferase activity. (C) RAW264.7 cells were treated with CA extract at the indicated concentrations. After 24 h, the cell lysates were immunoblotted with anti-RCAN1 and anti-GAPDH antibodies. The relative levels of RCAN1 were quantified and plotted (n = 3). (D) RAW264.7 cells were transfected with the NF-κB-luciferase reporter vector alone or together with either the shRNA expression vector or the scrambled RNA expression vector. After 24 h, cells were pretreated with the CA extract (10 μg/mL) for 30 min before LPS (10 ng/mL) treatment for 3 h, and cell lysates were analyzed for luciferase activity. (E) RAW264.7 cells were transfected with either the shRNA expression vector or the scrambled RNA expression vector. After 24 h, cells were pretreated with the CA extract (10 μg/mL) for 30 min before LPS (10 ng/mL) treatment for 3 h. The cell lysates were immunoblotted with anti-IL-1β, anti-RCAN1, and anti-GAPDH antibodies. The graphs are presented as the means ± SD of three independent experiments. (A–C) * p < 0.05, ** p < 0.01 compared with vehicle group. (D) * p < 0.05, ** p < 0.01 compared with indicated group.

