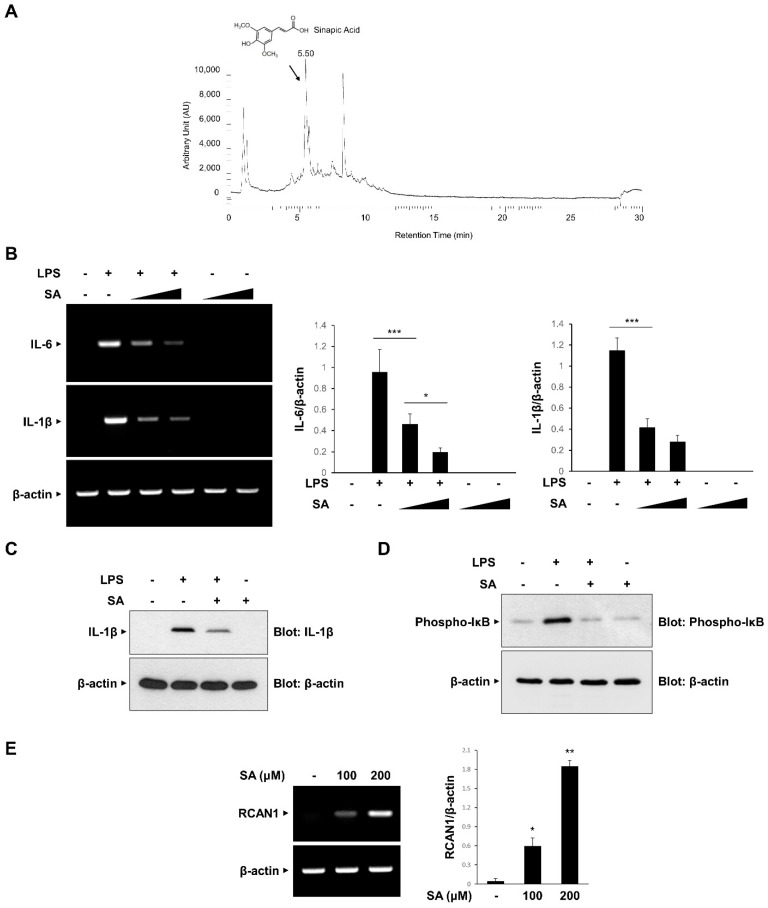
Figure 5.
Inhibitory effect of sinapic acid (SA) on the inflammatory signaling pathway. (A) Isolation of sinapic acid (SA). (B) RAW264.7 cells were treated with the SA (100 and 200 μM) for 30 min before LPS (10 ng/mL) treatment for 3 h. The mRNA levels of IL-6, IL-1β, and β-actin were measured by RT-PCR and then quantified. ∆ represents increasing concentrations of SA. (C,D) RAW264.7 cells were pretreated with the SA (100 μM) for 30 min before LPS (10 ng/mL) treatment for 3 h. The cell lysates were immunoblotted with anti-IL-1β, anti-phospho-IκB, and anti-GAPDH antibodies. (E) RAW264.7 cells were treated with SA at the indicated concentrations. The mRNA levels of RCAN1 and β-actin were measured using RT-PCR and quantified. The graphs are the means ± SD of three independent experiments. (B) *** p < 0.001 compared with indicated group. (E) * p < 0.05, ** p < 0.01 compared with vehicle group.

