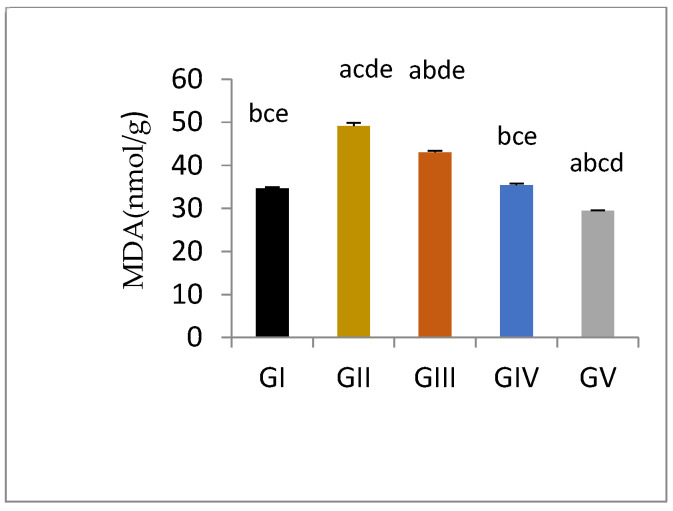
Figure 2.
Tissue MDA level measured spectrophotometrically in different groups, GI, CTL: normal control, GII, GM: gentamycin induced testicular damage, GIII, PIO5: pioglitazone treated (5 mg/kg/day), GIV, PIO10: pioglitazone treated (10 mg/kg/day) and GV, PIO20: pioglitazone treated (20 mg/kg/day). Values are expressed as mean ± SED, (a) compared to control group, (b) compared to a diseased group, (c) compared to PIO 5 (GIII) group, (d) compared to PIO 10 (G IV) group, (e) compared to PIO 20 (GV) group.

