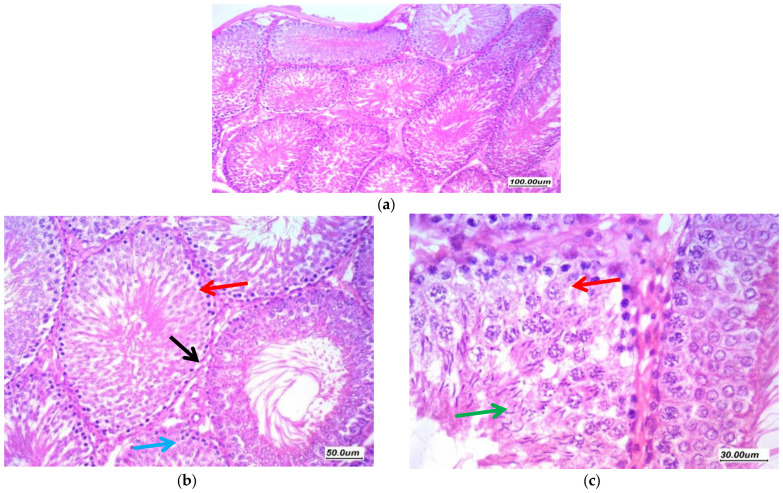
Figure 5.
Sections in the testis of a control group (GI, CTL) (a) 100×, (b) 200×, and (c) 400×. Testicular tissue showed regularly arranged seminiferous tubules with thin basement membrane (black arrow) lined by germ cells from basal spermatogonia (red arrow) showing regular maturation to the spermatid and spermatozoa stage. There are scattered Sertoli cells with associated spermatozoa (green arrow). The interstitial tissue showed scattered Leydig cells and thin small vessels (blue arrow).

